| On this page |
Overview 
The performance monitor is a profiler that records events and generates statistical reports for Houdini objects, such as nodes, viewports, scripts. The monitor can help identify performance bottlenecks in your scene.
Profiles 
A profile is a statistical snapshot of your scene. It stores the performance data for each profiled object in Houdini.
Create a new profile 
-
Start a new recording by clicking
 in the toolbar. This puts the performance monitor in a listening state, so that it records events that take place in Houdini.
 -
Perform actions in Houdini that will trigger events such as cooking and drawing.
-
Click the
 button to stop the recording and generate a new profile from the recorded events.
Note
You can turn on Live Updates in the Sample menu to see updated statistics during your recording session.
Statistics viewer 
The statistics viewer shows a breakdown of your profile.
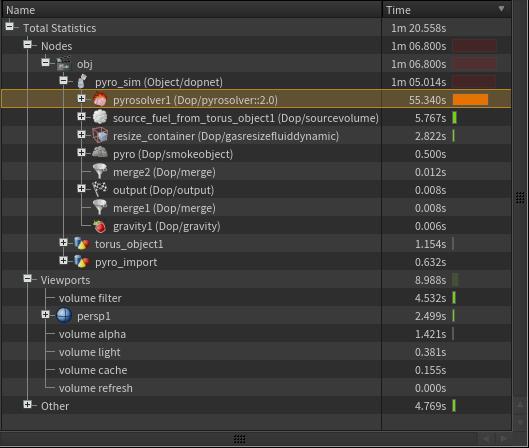
Profiled objects are listed on the left-hand-side of the viewer and are organized by nodes, viewports, and other objects. Performance statistics appear on the right side of the viewer for each profiled object in the list.
Statistics are categorized into three groups. You can change the display of these statistics by clicking ![]() Time or selecting them from the View menu.
Time or selecting them from the View menu.
Cumulative times
Show the time spent in a profiled object and in its descendants (i.e. its children, its children’s children, etc.). Cumulative timed statistics can be displayed in the statistics viewer either as absolute times or as percentages of the total time.
For example: Cook, Solve, Draw, Time
Self times
Show the time spent in a profiled object. It does not include the time spent in the object’s descendants.
For example: Cook (self), Solve (self), Draw (self), Time (self)
Event counts
Show the number of times an event took place in a profiled object.
For example: Cook Count, Solve Count, Draw Count
Toolbar 
![]()
Clears the statistics collected by the recording profile. This button only applies when recording with Live Updates turned on.
Starts a new recording. The performance monitor is put into an active state where it can record events in Houdini. You cannot view other profiles when the performance monitor is recording.
Stops the current recording. Statistics are generated for the recorded event and are stored in a new profile. The performance monitor is put back into a passive state.
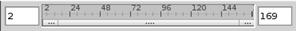
Specifies the frame range for which to display performance data. Only controls what data is displayed, data for all frames is always collected).
Menu 
Profile 
Open
Opens a profile from disk.
Save As
Saves the current profile to disk.
Export As.
Exports the current profile in comma-separated format (CSV) to disk. The exported .csv file can be loaded into a spreadsheet application such as Microsoft Excel and used to generate graphs.
Create Profile Comparison
Creates a difference profile from two existing profiles. This new profile shows changes in statistics between the given profiles.
Edit Performance Preferences
Allows you to modify Performance Monitor preferences, namely threshold values.
Delete
Close the current profile. This will not delete saved-to-disk profiles.
Sample 
The Record menu lists the event types that the performance monitor can record. Check the items for the events that you want the monitor to keep track of in the next recording.
Node Cooks
Records node cook events. This includes events for evaluating parameters, executing callback scripts, and running internal Python code (for Python OPs).
DOP Solves
Records DOP simulation solver events.
Node Draws (CPU)
Records events executed on the CPU that prepare nodes for drawing in the viewport.
Node Draws (GPU)
Records events executed on the GPU that prepare nodes for drawing in the viewport.
Viewport Draws
Records events that draw objects (i.e. geometry, handles, construction plane) in the viewport.
Scripts/Code
Records script and code events (i.e. Python, hscript, Houdini Engine).
Mantra Renders
Records events related to Mantra rendering.
Tip
You need to press the Render button in the Operation Controls toolbar to get stats in the Performance Monitor when using the ![]()
![]() Render Region tool.
Render Region tool.
Thread Stats
Monitors statistics based on individual threads.
Frame Stats
Monitors frame events and outputs them in the Event Log View.
Memory Stats
Monitors statistics for memory-related events.
Note
Recorded memory statistics may be inaccurate if multi-threaded cooking is enabled. At the moment, multi-threaded cooking applies only to compositing networks and can be disabled in the Houdini Preferences dialog.
Errors
Monitors warnings and errors.
Select All
Turn on sampling for all events.
Select None
Turn off sampling for all events.
Live Updates
Updates statistics every few seconds during a recording session.
View 
View Absolute Times
View the times in the stats viewer as absolute times, that is, display the times in hours, minutes, and seconds.
View Percentage Times
View the times in the stats viewer as percentages of the total time spent in the recorded events.
View Time in Seconds
View absolute times in hours, minutes, and seconds.
View Time in Milliseconds
View absolute times in milliseconds.
Tree View
Shows recorded statistics in a tree view.
List View
Shows recorded statistics in a list view.
Event Log View
Shows the event log instead of the recorded statistics.
The Enable Output checkbox turns on performance logging. You must turn this option on to see any output. The Clear button clears any logged output in the window.
General Stats
Time
The total time spent on an item, such as a node or viewport. This includes its children, and its children’s children, etc. The total time sums up the cook, draw and solve times.
Time (Self)
The total time spent on an item. The total time sums up the cook, draw and solve times.
Cook Stats
Cook
The time spent cooking a node, its children, its children’s children, etc.
Cook (Self)
The time spent cooking a node.
Cook Count
The number of times that a node was cooked.
Cook (Avg)
The average time spent cooking a node.
Cook (Min)
The least amount of time spent cooking a node.
Cook (Max)
The most amount of time spent cooking a node.
Solve Stats
Solve
The time spent by a DOP node, its children, and its children’s children, etc. solving a DOP simulation.
Solve (Self)
The time spent by a DOP node solving a DOP simulation.
Solve Count
The number of times that a DOP node solved a DOP simulation.
Solve (Avg)
The average time spent solving a node.
Solve (Min)
The least amount of time spent solving a node.
Solve (Max)
The most amount of time spent solving a node.
Draw Stats
Draw
For nodes, this is the time spent preparing an object node, its children, and its children’s children, etc. to be drawn in the viewport. For viewports, this is the time spent rendering all of the components in the viewport, such as handles, guides, construction plane.
Draw (Self)
For nodes, this is the time spent preparing an object node to be drawn in the viewport. For viewports, this is the time spent rendering a single component in the viewport.
Draw Count
For nodes, this is the number of times that a node was prepared for drawing. For viewports, the number of times that a component was rendered in the viewport.
Draw (Avg)
The average time spent drawing a node.
Draw (Min)
The least amount of time spent drawing a node.
Draw (Max)
The most amount of time spent drawing a node.
GPU Draw Stats
GPU Draw
For nodes, this is the time spent preparing an object node, its children, and its children’s children, etc. to be drawn in the viewport using the GPU. For viewports, this is the time spent rendering all of the components in the viewport, such as handles, guides, construction plane using the GPU.
GPU Draw (Self)
For nodes, this is the time spent preparing an object node to be drawn in the viewport using the GPU. For viewports, this is the time spent rendering a single component in the viewport using the GPU.
GPU Draw Count
For nodes, this is the number of times that a node was prepared for drawing using the GPU. For viewports, the number of times that a component was rendered in the viewport using the GPU.
GPU Draw (Avg)
The average time spent drawing a node using the GPU.
GPU Draw (Min)
The least amount of time spent drawing a node using the GPU.
GPU Draw (Max)
The most amount of time spent drawing a node using the GPU.
Script Stats
Script
The cumulative time spent executing a function or code block, and any code it calls.
Script (Self)
The time spent executing a function or code block.
Script Count
Number of times a function or code block is executed.
Script (Avg)
The average time spent executing a function or code block.
Script (Min)
The least amount of time spent executing a function or code block.
Script (Max)
The most amount of time spent executing a function or code block.
Render Stats
Render
The cumulative time spent executing a render-related function or code block, and any code it calls.
Render (Self)
The time spent executing a render-related function or code block.
Render Count
Number of times a render-related function or code block is executed.
Render (Avg)
The average time spent executing a render-related function or code block.
Render (Min)
The least amount of time spent executing a render-related function or code block.
Render (Max)
The most amount of time spent executing a render-related function or code block.
Tips 
To clear the colored highlights, you can either delete all of the recorded profiles in the Performance Monitor or you can open the Network Editor Display Options by pressing Space + D in the network editor and uncheck Display Performance Statistic on the Display tab.
| See also |