| On this page |
Overview 
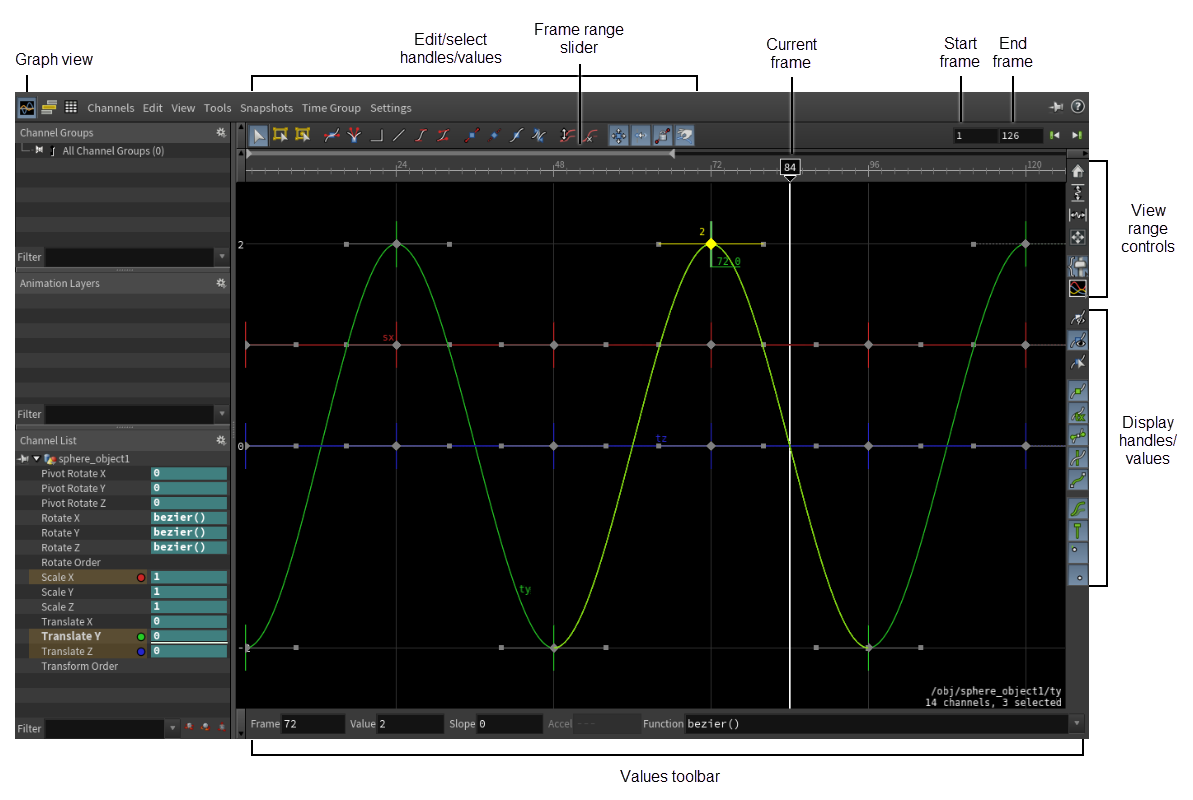
The graph view lets you view and edit animated parameters (channels) as graphs of their values over time. It is one view of the animation editor. You can also use the ![]() dopesheet and
dopesheet and ![]() table view to edit animation. To switch between these views, use the buttons at the top left corner of the animation editor.
table view to edit animation. To switch between these views, use the buttons at the top left corner of the animation editor.
Channels record how the value of a parameter changes over time. You can think of a channel as a parameter animation.
A channel is an extra object associated with a parameter. It stores keyframe information, essentially acting as a keyframe container for the parameter. If you delete all of the keyframes on a parameter, you end up with a parameter with an empty channel (a channel that does not hold any keyframes).
A channel consists of a series of segments. Each segment has two end points, and each end point is at a key and has the following properties - value, slope, and acceleration.
Each segment has a function associated with it that determines the curve’s behaviour between keyframes. Different functions use different end point properties. For example, the constant segment function uses the value property of the first end point only, while the bezier segment function uses all three properties (slope, acceleration, and value) at both end points.
The graph view displays only the selected channels in the channel list. When a channel is displayed in the graph, it is available for viewing and editing in the animation editor’s graph, dopesheet, and table views.
Navigation 
| To... | Do this |
|---|---|
|
Pan and zoom the view |
Drag |
|
Frame the data |
To show all the graph data, click To show all the graph data vertically, click To show all the graph data horizontally, click |
|
Frame part of the data |
|
|
Change the current time |
Use any of the following:
|
Adding and deleting keys 
| To... | Do this |
|---|---|
|
Add a key |
Use any of the following:
|
|
Remove a key |
Use any of the following:
|
Editing curves 
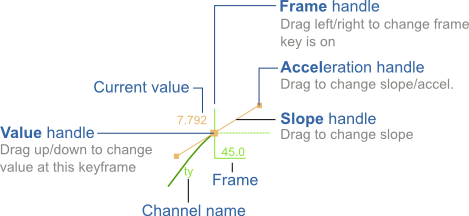
The following illustration shows the handles at each keyframe. The handles correspond to the text boxes at the bottom of the graph (Frame, Value, Slope, and Accel), which allow you to set the handles to exact values. The buttons on the right toolbar control the display of keyframe handles and values on the graph.
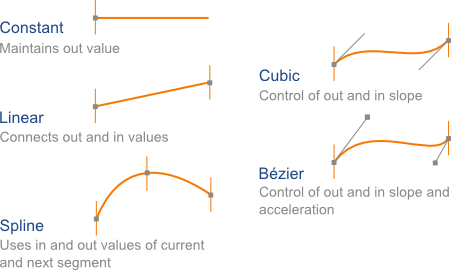
To control how Houdini connects the two ends of a segment, select a segment on the graph and choose a function from the Function menu below the graph. Some common functions:
You can also change the options on the slope, value and acceleration handles at each keyframe, including:
| To... | Do this |
|---|---|
|
Select a keyframe and its associated handles |
|
|
Only select handles on a specific channel |
If a channel has handles that are already selected, holding S and making a box selection only selects handles on that channel; handles on other channels are not selected. (If S is not held, box selection selects handles on all channels.) |
|
Change the shape of a graph segment |
or Use the handles on the selected keys in the graph to adjust the shape of the curve. You can also type exact values for the selected handle in the Value, Slope, and Accel text boxes on the bottom toolbar. or Use curve pulling to edit Bezier and cubic segments. With curve pulling, you can change the shape of the curve by
|
|
Go to the previous/next keyframe |
, or ⇧ Shift + ← to go to the previous keyframe. . or ⇧ Shift + → to go to the next keyframe. |
|
Move the selected keyframe without having the cursor directly over the keyframe |
|
|
Move a keyframe in time (move in X) |
Time values on the graph have a line under them. When you turn on Settings ▸ Snap Moved Keys to Nearest Frame, the keys will move to the nearest integer frame when you finish dragging. You can also turn on this option by clicking |
|
Move a keyframe in Y |
Drag the value handle up and down. |
|
Move a keyframe in X or Y |
|
|
Move a keyframe in X and Y at the same time |
Hold ⌃ Ctrl and drag the value handle. This is the same functionality as turning off the Constrain to Axis option (deselecting |
|
Move a keyframe forward or backward a specific number of frames |
|
|
Set the slope to zero (flat tangent) |
|
|
Set the slope to automatic |
|
|
Copy a keyframe value |
|
|
Change a value at a keyframe |
Drag the value handle up or down. or
|
|
Lock the slope orientation and only change the acceleration |
Hold ⌃ Ctrl and drag the acceleration handle. |
|
Select all of the same type of handles on a channel |
Double-click the handle. |
|
Add all of the same type of handles to the existing selection |
⇧ Shift double-click the handle. ⌃ Ctrl + ⇧ Shift double-click removes the same type of handles from the selection. |
|
Select additional handles using a box selection |
Hold ⇧ Shift and ⌃ Ctrl + ⇧ Shift and |
|
Change multiple values at once |
Select multiple handles. Then drag one of the selected handles to move all of them at once. If you select handles with different values, the Value field will show |
Edit/Select toolbar 
The toolbar above the graph provides several quick access options for editing and changing the functionality of various handles and values. When you hover over a button, a tooltip will display the button name and any associated hotkeys.
![]() Selection Tool
Selection Tool
![]() Set Selected Slopes to Automatic
Set Selected Slopes to Automatic
![]() Swap Active Channels and Snapshots
Swap Active Channels and Snapshots
Display toolbar 
The right toolbar provides several quick access options for displaying and framing the selected channels, as well as turning on and off the display of various keyframe handles and values. When you hover over a button, a tooltip will display the button name and any associated hotkeys. Buttons that have an arrow at the bottom right corner (for example, ![]() ) have addition options.
) have addition options. ![]() on the button to view the options.
on the button to view the options.
![]() Home Channels (All Graphs)
Home Channels (All Graphs)
Homes all the channels by panning and zooming the main window to show all the keys in the graph or dopesheet.
![]() Vertical Adapt
Vertical Adapt
Automatically pans and zooms the graph to keep all the vertical values visible when selecting different channels.
![]() Horizontal Adapt
Horizontal Adapt
Automatically pans and zooms the graph to keep all the horizontal values visible when selecting different channels.
![]() Frame Selection
Frame Selection
Pans and zooms the main window to show the area of the graph or dopesheet that is selected.
![]() Toggle Normalized Values Display Mode
Toggle Normalized Values Display Mode
Provides options for displaying channels with normalized values.
Note
![]() Toggle Normalized Values Display Mode is deselected by default. When deselected, the graph always displays the Parameter UI Range mode regardless of the mode you select from the
Toggle Normalized Values Display Mode is deselected by default. When deselected, the graph always displays the Parameter UI Range mode regardless of the mode you select from the ![]() options.
options.
![]() this button to display the following options:
this button to display the following options:
![]() Parameter UI Range
Parameter UI Range
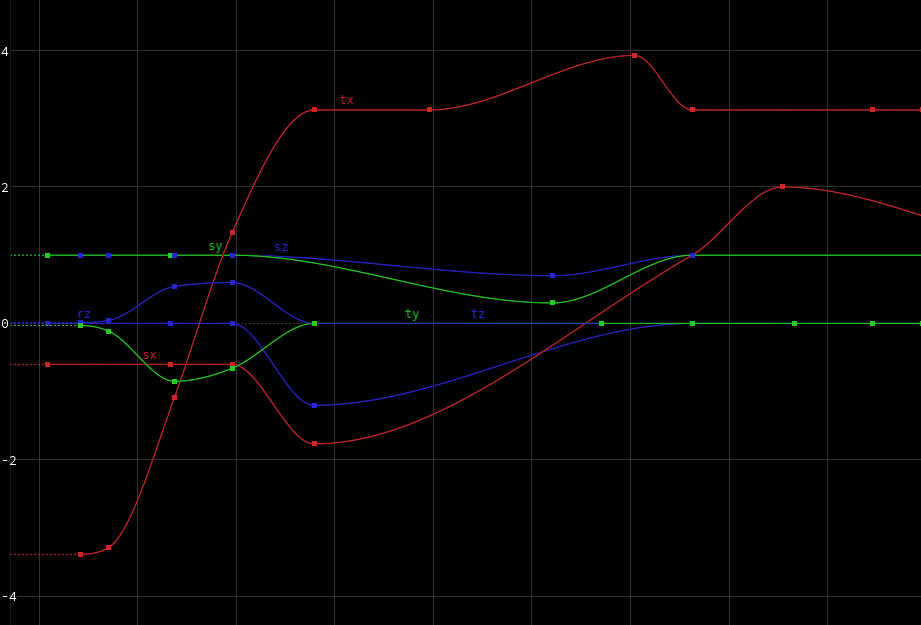
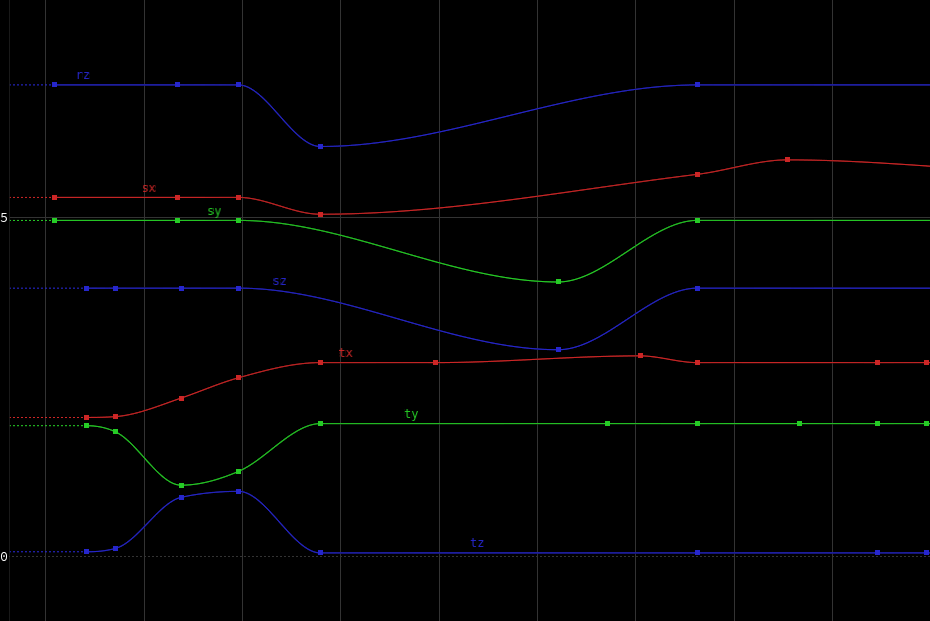
The Parameter UI Range mode is the default display mode. It displays the channels at their regular values.
![]() Animation Range
Animation Range
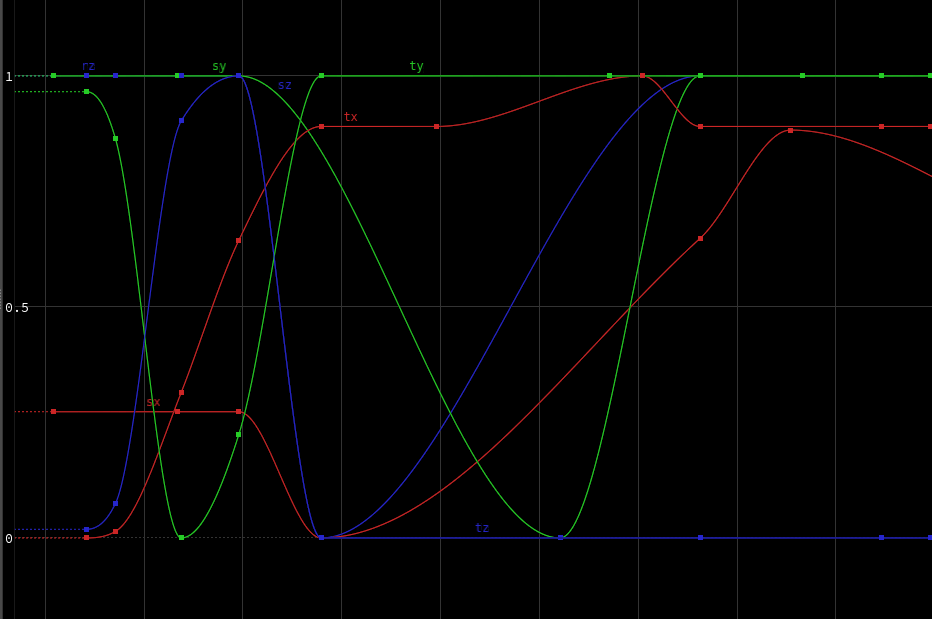
The Animation Range mode normalizes all of the displayed channels so that their values are between 0 and 1. When you have channels that differ widely in their range of values (for example, one channel that varies between 0 and 2, and another that varies between -50 and 50), this option helps to see the relative changes on the different channels.
![]() Animation Range with Offset
Animation Range with Offset
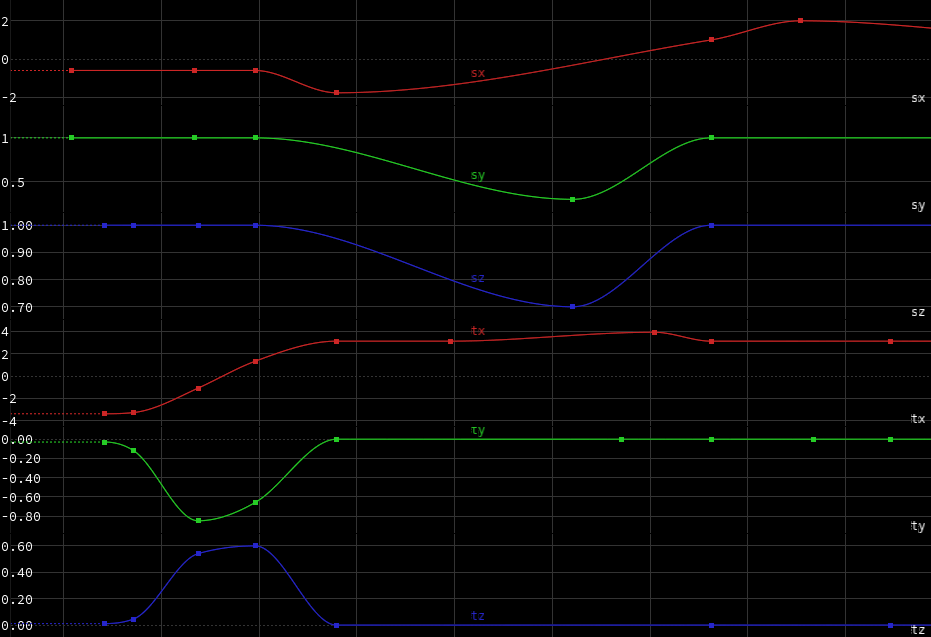
The Animation Range with Offset mode normalizes all of the displayed channels so that their values are between 0 and 1 (similar to the Animation Range mode), and stacks the different channels vertically in the graph so that the individual channels are easier to see.
![]() Toggle Multi Graph Display Mode
Toggle Multi Graph Display Mode
Provides options for displaying channels in separate graphs within the graph display space.
Note
By default, this option is set to display the selected channels overlapping on one graph. You need to click this button to display the channels separately. When the button is toggled, the icon will change to display the selected number of graphs (for example, ![]() for 1 graph,
for 1 graph, ![]() for 6 graphs).
for 6 graphs).
At the default setting, the graph always displays the channels overlapping, regardless of the number of graphs you select from the ![]() options.
options.
![]() this button to set the number of graphs displayed from 1 to 6. If you set the graph to display, say, 3 channels, and you select 6 channels in the channel list, then the graph will only display the first 3 channels that are selected.
this button to set the number of graphs displayed from 1 to 6. If you set the graph to display, say, 3 channels, and you select 6 channels in the channel list, then the graph will only display the first 3 channels that are selected.
![]() Show Selected Handles - Only show the frame (time mark), value, slope, and acceleration handles of the selected keyframe(s).
Show Selected Handles - Only show the frame (time mark), value, slope, and acceleration handles of the selected keyframe(s).
![]() Show Slope and Acceleration Handles
Show Slope and Acceleration Handles
![]() Show Time Mark Handles - Shows the frame handles.
Show Time Mark Handles - Shows the frame handles.
![]() Show Segment Handles - If turned off, the curve segments are shown as dotted lines.
Show Segment Handles - If turned off, the curve segments are shown as dotted lines.
Channels menu 
Edit menu 
Cut/Copy/Paste
Cuts, copies, or pastes all selected handles using the Paste Settings.
Paste Settings
Channel copy and paste works by storing the selected handles in a temporary file. The animated range, channel names, full paths, and row order of the currently displayed channels are also stored in the file. This information can be used to perform a mapping between the copied channel list and the target channel list.
Using Channel Names
Channel mapping is performed based on channel names. This works well for transferring animation between 2 nodes of the same type with the same parameter layout.
Note
Use this with caution when copying multiple transform nodes at the same time, as it will only paste the first occurrence of the channel name.
Using Full Paths
Channel mapping is performed based on full paths. This works well when doing copy/paste to and from the same channels. It will behave correctly even if the list of channels is changing. This mode will not allow copy/paste between different channels.
Using Row Order
Channel mapping is performed using the row order in the displayed channels at the moment of the copy operation and the row order at the moment of the paste operation. It counts parameters without valid channels to make it possible to copy/paste to a node without any channels, or to a node with a different set of channels.
At Current Time
Paste the copied handles at the current time.
At Original Time
Paste the copied handles at their original time.
On Parameters with Existing Channels
Paste only on parameters with existing channels.
On All Parameters
Paste on all the displayed parameters, creating missing channels.
Delete
Deletes the selected channels.
Select All Handles
Selects all the handles on the displayed channels.
Select No Handles
Clears the handle selection.
Invert Handle Selection
Selected handles become unselected. Unselected handles become selected.
Snap Selected Keys to Nearest Frame
Each selected key is rounded in time to the nearest integer frame.
Tie/Untie
Tie locks the left and right slope/value handles together (changing one side changes the other). When the handles are untied, you can alter the left and right handles independently.
To tie/untie the slope handles, select one side of the slope handle and choose this option.
To tie/untie both the slope and value handles, select the slope and value handles together by ![]() dragging the area around the key, then choose this option.
dragging the area around the key, then choose this option.
You can also tie/untie the slope and value handles by clicking ![]() Tie Handles,
Tie Handles, ![]() Untie Handles,
Untie Handles, ![]() Tie Values and
Tie Values and ![]() Untie Values on the top toolbar.
Untie Values on the top toolbar.
Note
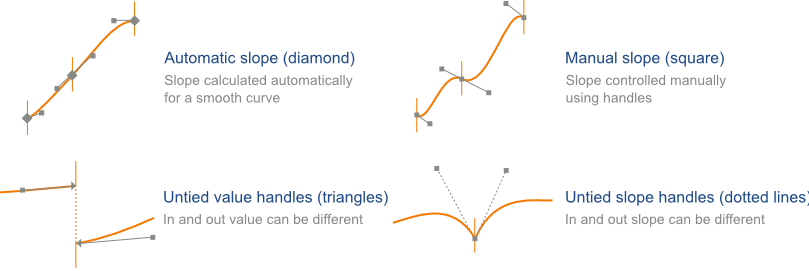
Tied slope handles are displayed as a solid line. Untied slope handles are displayed as a dotted line.
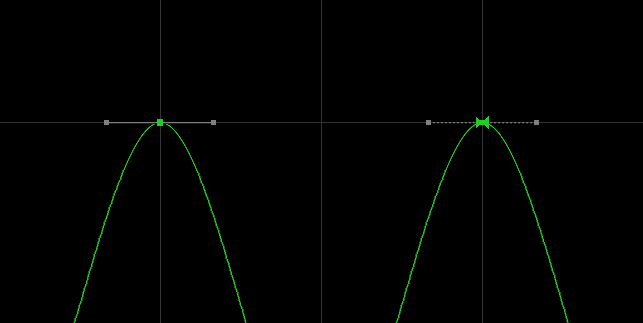
For a keyframe with its slopes set to automatic (see the Set Selected Slopes to Manual/Automatic option), tied value handles are displayed as one diamond at the keyframe, and untied value handles are displayed as two adjacent diamonds at the keyframe.
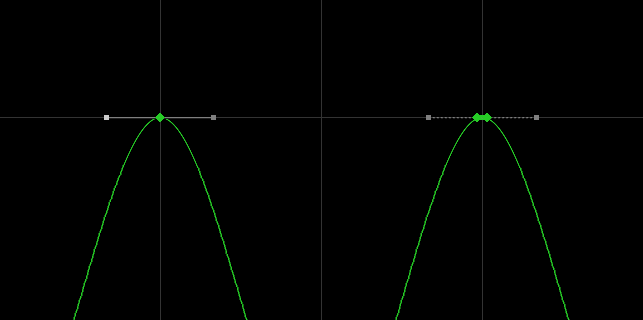
For a keyframe with its slopes set to manual, tied value handles are displayed as a square at the keyframe, and untied value handles are displayed as two half diamonds at the keyframe.
Note
If one side of a keyframe has a manual slope, and the other side has an automatic slope, the slopes will be untied.
Set Selection to Default Values
Sets the values of the selected keys to their default values (depends on the parameter values).
Set Selected Slopes to Zero
Sets the selected slopes to have a value of 0 (ie. horizontal).
Set Selected Slopes to Manual/Automatic, Toggle Selected Slopes Mode
Sets an auto-slope flag that controls the slope orientation going into and coming out of a keyframe.
When the auto-slope flag is set to automatic, Houdini automatically adjusts the slope orientation of the keyframe depending on its position in relation to its adjacent keyframes, i.e. as you move the keyframe or its adjacent keyframes, the slope orientation changes.
When the auto-slope flag is set to manual, the slope orientation at the keyframe stays the same regardless of how the keyframe is positioned in relation to its adjacent keyframes, i.e. as you move the keyframe or its adjacent keyframes, the slope orientation stays the same.
If the key for a channel is at a local minimum or maximum, the slope at that key will be set to 0.
Select the key handles by ![]() dragging the area around the key, or selecting the individual slope handles. Then choose one of Set Selected Slopes to Manual/Automatic to set the auto-slope flag, or toggle the flag (Toggle Selected Slopes Mode).
dragging the area around the key, or selecting the individual slope handles. Then choose one of Set Selected Slopes to Manual/Automatic to set the auto-slope flag, or toggle the flag (Toggle Selected Slopes Mode).
You can also set the auto-slope flag by clicking ![]() Set Selected Slopes to Manual or
Set Selected Slopes to Manual or ![]() Set Selected Slopes to Automatic on the top toolbar.
Set Selected Slopes to Automatic on the top toolbar.
Note
Keyframes with their slopes set to automatic are drawn as diamonds. Keyframes with their slopes set to manual are drawn as squares.
In the below video, the slope of the left keyframe is set to automatic (keyframe is drawn as a diamond), and its slope orientation is automatically adjusted when the right keyframe is moved down.
In the below video, the slope of the left keyframe is set to manual (keyframe is drawn as a square), and its slope orientation stays the same when the right keyframe is moved down.
Set Selected Slopes to Linear
Sets the selected slope so that its slope orientation makes a straight line with the previous keyframe.
Smooth Selected Slopes
Sets the value of the selected slopes so that there is no overshoot at the keyframes. If the key for a channel is at a local minimum or maximum, the slope at that key is set to 0. All other slopes are given an approximate value that results in a smooth transition between its adjacent keys. Smoothing also normalizes the acceleration values.
Set Selected Segments to
Allows you to change the segment function. See functions for more information.
Filter Euler Rotations of Selected Channels
The Euler filter fixes bad rotation interpolations that occur when animating rotations using Euler angles over large angles. A common issue is the rotation flipping the wrong way between keyframes.
To apply the filter, select any handle on all 3 rotation channels and apply the filter. The filtering operation is applied to all of the channels that have a selected handle, and it affects the whole channel. The rotation order on the object node affects the filtering operation. (The rotation order is found in the right drop-down menu of the Transform Order parameter of an object node.)
The filter should only be used on rotation channels. Rotations from multiple objects can be filtered at the same time.
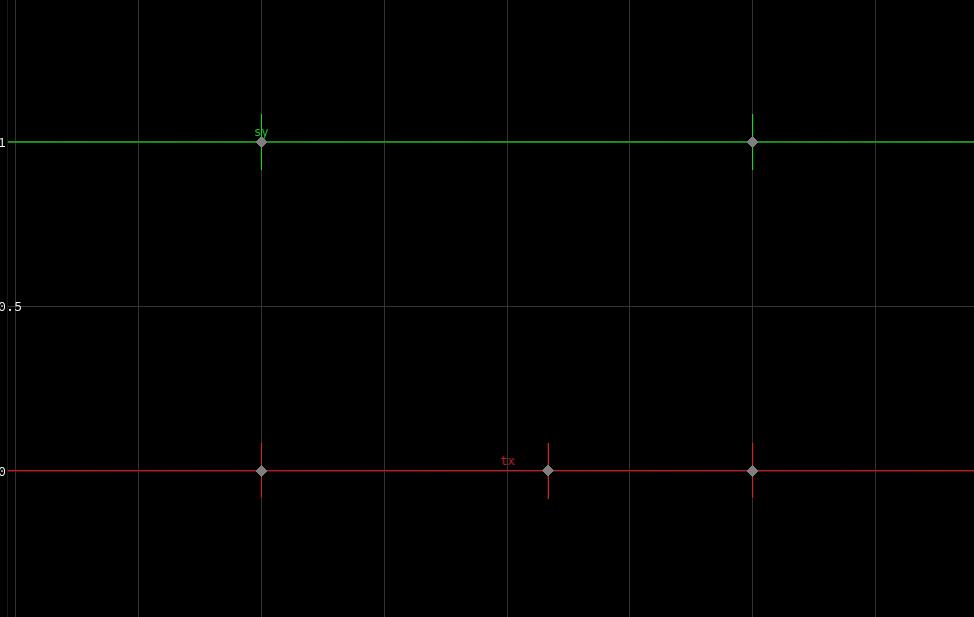
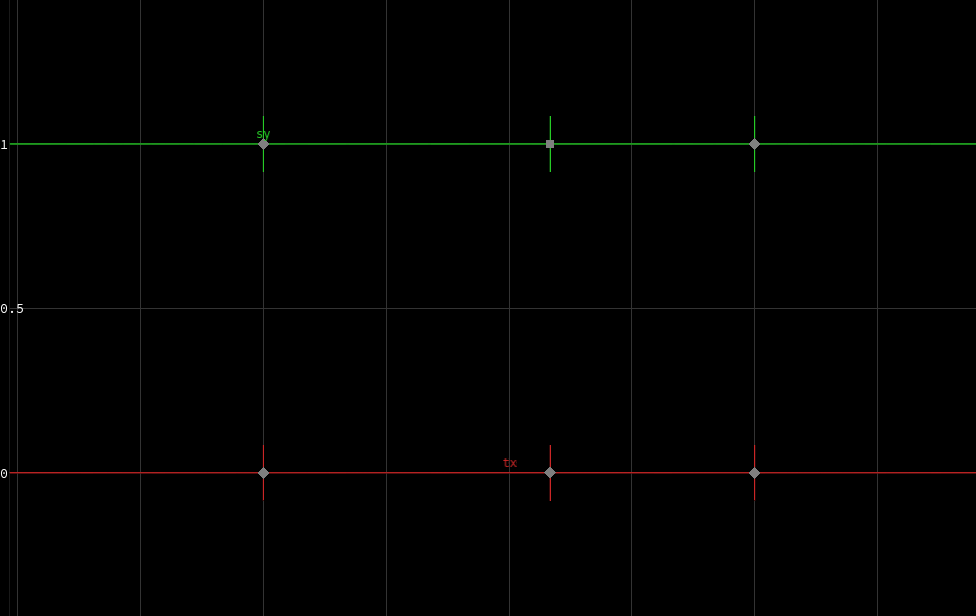
Match Keyframes of Selected Keys
Creates missing keyframes on channels at the selected keys. This ensures that the selected channels have matching keyframes at the same frame.
In the example below, ![]() drag to select all of the displayed keyframes on the green and red channels. Then choose Edit ▸ Match Keyframes of Selected Keys.
drag to select all of the displayed keyframes on the green and red channels. Then choose Edit ▸ Match Keyframes of Selected Keys.
Reduce Keyframes of Selected Segments
Opens a window with options to perform a cubic curve refitting on the selected segments after applying a default resampling operation. Refitting reduces the number of keyframes while trying to keep the same curve shape.
Segment expressions and CHOP exports can be baked to keyframes. Keyframes can also be set on animation that is cycled (repeated) if you provide a frame range that is outside the first and last keyframes of the channel.
Refit Segments
Preserve Extremas
When turned on, preserves the local minimas and maximas.
Smooth Slopes After Refit
When turned on, applies auto-slopes to the segments after refitting.
Set Bezier Function on Segments
When turned on, forces the segments to be Bezier segments even if the refitting creates cubic curves.
Resample First
When turned on, performs resampling before refitting. When turned off, does not perform resampling before refitting.
Tolerance
When keyframes are closer than this value in frames, they are merged.
Override Range from Selected Segments
Enable
Turns on/off the explicit range. When turned off, the channel ranges come from the selected segments. When turned on, the channel range is overridden by the start and end values. This is useful for baking channel extrapolation, CHOP exports, and expressions.
Start/End Frames
Defines the start and end frame range to use when Enable is turned on for Override Range from Selected Segments.
Enable Preview
When turned on, shows a preview of the refitting operation in the graph view.
Bake CHOP Exports to Channels
Defines what to do when a parameter is driven by a CHOP export.
Off
Don’t bake CHOP exports.
Bake, Keep Export Flags
Performs the baking but leaves the CHOP export flag in place. The parameter is still driven by the CHOP export, but the baked animation is present on the channel.
Bake, Disable Export Flags
Performs the baking and disables the CHOP export flags on all the CHOP nodes. This does not take into account the possibility that the CHOP nodes can be exporting to other parameters. Use this only when you know that you are baking all the channels exported from a CHOP node.
Bake, Create Delete CHOPs and Move Export Flags
Performs the baking and creates ![]() Delete CHOP nodes to disable the exported channels individually.
Delete CHOP nodes to disable the exported channels individually.
Bake Keyframes of Selected Segments
Opens a window with options to perform a cubic curve resampling on the selected segments. Resampling adds keyframes without changing the curve’s shape.
Resampling allows segment expressions and CHOP exports to be baked to keyframes. Keyframes can also be set on animation that is cycled (repeated) if you provide a frame range that is outside the first and last keyframes of the channel.
Resample Segments
Rate (at every frame)
Adds keyframes at every n frames or fractional frames.
Tolerance
While resampling, when keyframes are closer than this value in frames, they are merged.
Override Range from Selected Segments
Enable
Turns on/off the explicit range. When turned off, the channel ranges come from the selected segments. When turned on, the channel range is overridden by the start and end values. This is useful for baking channel extrapolation, CHOP exports, and expressions.
Start/End Frames
Defines the start and end frame range to use when Enable is turned on for Override Range from Selected Segments.
Enable Preview
When turned on, shows a preview of the resampling operation in the graph view.
Bake CHOP Exports to Channels
Defines what to do when a parameter is driven by a CHOP export.
Off
Don’t bake CHOP exports.
Bake, Keep Export Flags
Performs the baking but leaves the CHOP export flag in place. The parameter is still driven by the CHOP export, but the baked animation is present on the channel.
Bake, Disable Export Flags
Performs the baking and disables the CHOP export flags on all the CHOP nodes. This does not take into account the possibility that the CHOP nodes can be exporting to other parameters. Use this only when you know that you are baking all the channels exported from a CHOP node.
Bake, Create Delete CHOPs and Move Export Flags
Performs the baking and creates ![]() Delete CHOP nodes to disable the exported channels individually.
Delete CHOP nodes to disable the exported channels individually.
Smooth Selected Channels
Apply smoothing to selected channels by removing unwanted jitter and noise.
Note
This window’s options provide the same functionality as the ![]() SmoothMotion SOP node.
SmoothMotion SOP node.
Filter Type
Specifies the type of low-pass filter to smooth the channels with. Currently only the Butterworth Filter is available.
Cutoff Frequency
Sets the cutoff frequency for the filter. Frequencies higher than this value are filtered out/removed on the output.
Filter Order
Sets the order of the filter. This determines how steeply the filter curve rolls off after the cutoff frequency. Higher values correspond to a steeper roll off.
Range
Determines the channel range to apply the smoothing.
Full Channel
Apply the filter to the full channel.
Selection Only
Apply the filter only to the selected portion of the channel.
Playbar Range
Apply the filter only to the range specified in the playbar.
Sampling Rate
Specifies the samples per second. Keys are added to channels at this sampling rate.
Resample Keys
When turned on, resamples the keys when smoothing channels. When turned off, preserves the existing key times.
Snap Keys
When turned on, any keys at fractional frames are moved to integer frame values.
View menu 
Home Channels (Current Graph/All Graphs)
Pans and zooms the graph to show all the keys in the current graph or in all the graphs.
Home Playback Range (All Graphs)
Zooms the graphs to the playback range, which is between the start and end frames shown on the playbar.
Home Global Range (All Graphs)
Zooms the graphs to show the .hip file’s global animation range, see playbar.
Frame Selection
Zooms the graphs to show only the selected keys.
Scroll to Current Frame
Pans the graph to the current frame.
Horizontal/Vertical Adapt
When turned on, the graph automatically pans and zooms to keep all horizontal and/or vertical values visible.
Show Box Handle
When turned on, displays handles that allow you to move blocks of keys. You can also turn on this option by selecting a group of keys in the graph and pressing Y, or clicking ![]() Box Handle on the top toolbar and selecting a group of keys.
Box Handle on the top toolbar and selecting a group of keys.
You can drag the edges of the box to translate the group of keyframes from side to side or up and down. The axis is locked, so you can only move the keyframes along one axis at a time. To move along both axes at the same time, hold ⇧ Shift while dragging the edges of the box.
To scale, drag a corner of the box.
Show Box Pivot
When turned on, displays a pivot handle at the center of the box handle. You can also turn on this option by clicking ⇧ Shift + Y in the graph, or clicking ![]() Box Handle with Pivot above the graph and selecting a group of keys. Any scaling is done around the pivot location.
Box Handle with Pivot above the graph and selecting a group of keys. Any scaling is done around the pivot location.
To move your pivot, simply drag it to another location. To move it back to the center, click ⇧ Shift + Y + Y. This turns the pivot off and then on again, moving it back to the center.
Show Handles
Choose whether all handles, selected handles or no handles are displayed on the graph. You can also turn on this option by clicking ![]() Hide All Handles,
Hide All Handles, ![]() Show All Handles or
Show All Handles or ![]() Show Selected Handles on the right toolbar.
Show Selected Handles on the right toolbar.
Show Values
When turned on, shows the value handles at the keyframes. You can drag the handles to change the parameter value at that keyframe (Value in the toolbar below the graph). If the values at the key are tied together, the value handle is a diamond. If the values at the key are untied, the value handle is two adjacent diamonds. You can also turn on this option by clicking ![]() Show Value Handles on the right toolbar.
Show Value Handles on the right toolbar.
Show Time Marks
When turned on, shows the short vertical lines (frame handles) indicating the keyframes. You can drag the frame handle left or right to move the keyframe in time. You can also turn on this option by clicking ![]() Show Time Mark Handles on the right toolbar.
Show Time Mark Handles on the right toolbar.
Show Slopes and Acceleration
When turned on, shows the short lines and round handles indicating the slope and acceleration of segments as they enter and leave a keyframe. You can drag the slope lines and/or acceleration handles to change the shape of the segment (for segments functions that use slopes and/or acceleration). You can also turn on this option by clicking ![]() Show Slope and Acceleration Handles on the right toolbar.
Show Slope and Acceleration Handles on the right toolbar.
When ![]() Show Slope and Acceleration Handles is on, and the default segment function is Bezier (default function is set in the animation preferences, Edit ▸ Preferences ▸ Animation ▸ Default Function):
Show Slope and Acceleration Handles is on, and the default segment function is Bezier (default function is set in the animation preferences, Edit ▸ Preferences ▸ Animation ▸ Default Function):
-
Slope and acceleration handles are shown for segments with Bezier, linear, ease, easein, or easeout functions.
-
Only slope handles are shown for cubic segment functions.
-
Dragging the slope/acceleration handles for the linear, ease, easein, and easeout segment functions, or changing their slope/acceleration values on the values toolbar will change the segment into a Bezier function.
When ![]() Show Slope and Acceleration Handles is on, and the default segment function is cubic:
Show Slope and Acceleration Handles is on, and the default segment function is cubic:
-
Only slope handles (no acceleration handles) are shown for segments with cubic, linear, ease, easein, or easeout functions.
-
Slope and acceleration handles are shown for Bezier segment functions.
-
Dragging the slope handles for the linear, ease, easein, and easeout segment functions, or changing their slope on the values toolbar will change the segment into a cubic function.
Note
The default segment function is usually set to Bezier.
See functions for more information on the different types of segment functions.
Tip
If the slope handles are hard to see because they are too short, you can change the length of the slope handles in Settings ▸ Slope Handle Length.
Show Functions
When turned on, allows the selection of segments so that you can change the function that controls their shape. When turned off, the curve segments are shown as dotted lines. You can also turn on this option by clicking ![]() Show Segment Handles on the right toolbar.
Show Segment Handles on the right toolbar.
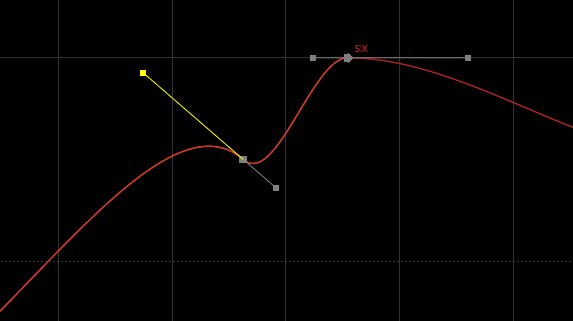
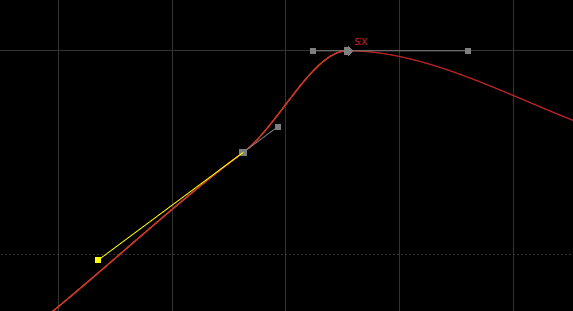
Show Time Groups
When turned on, shows time groups. A time group is displayed as a vertical yellow line. Keyframes that belong to a time group have a dotted yellow line connecting them to the time group line. Dragging the time group line left or right moves the grouped keyframes in time. You can also turn on this option by clicking ![]() Show Time Group Handles on the right toolbar.
Show Time Group Handles on the right toolbar.
Show Time Bar
When turned on, displays a vertical line on the graph that indicates the current frame.
Show Bookmarks
Displays bookmarks as labelled bars in the timebar above the graph, and/or as colored blocks on the graph.
Show Full Channel Names
When turned on, displays the full name of the channel in the graph. For example, box_object1/tx, box_object1/ty, box_object1/tz.
Show Channel Names
When turned on, displays the name of the channel in the graph. For example, tx, ty, tz. You can also turn on this option by clicking ![]() Show Channel Names on the right toolbar.
Show Channel Names on the right toolbar.
When many channels are displayed, turning off Show Channel Names makes the graph view run significantly faster. Turning off both Show Channel Names and Draw Past Channel Ends further improves performance.
Show Times for Selected Marks
When turned on, displays the frame number for the selected time marks. You can also turn on this option by clicking ![]() Show Frame Numbers on the right toolbar.
Show Frame Numbers on the right toolbar.
Show Values for Selected Keys
When turned on, displays the graph value for the selected keys. You can also turn on this option by clicking ![]() Show Value Numbers on the right toolbar.
Show Value Numbers on the right toolbar.
Show Only Attached Time Groups
When turned on, the graph only shows time groups that have visible keyframes attached.
Draw Past Channel Ends
When turned on, draws a horizontal dotted line before the first keyframe and after the last keyframe.
When many channels are displayed, turning off Draw Past Channel Ends makes the graph view run significantly faster. Turning off both Draw Past Channel Ends and Show Channel Names further improves performance.
Draw CHOP exports
When turned on, displays the curves of CHOP exports.
Tools menu 
Snapshots menu 
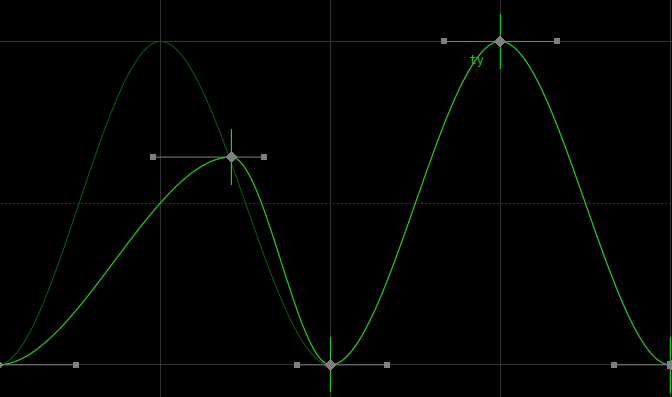
Snapshots allow you to compare the before and after state of the curve as you make changes to the animation. This can be used to quickly revert a keyframe animation to its previous state.
The current state of the curve is displayed as a solid line. As you make changes to the curve with snapshots turned on, the previous state of the curve (the snapshot) is displayed as a lighter dotted line.
Enable Channel Snapshots
When turned on, creates a temporary copy (snapshot) of the channel every time the keyframe animation changes. You can also turn on this option by clicking ![]() Enable Channel Snapshots on the right toolbar.
Enable Channel Snapshots on the right toolbar.
Persistent Channel Snapshots
When turned on, keeps the snapshot when the channel editor refreshes to show new channels. When turned off, deselecting and reselecting the node clears the snapshot.
Revert Active Channels to Snapshots
Returns the keyframe animation to its snapshot (previous) state.
Swap Active Channels and Snapshots
Switches between the updated channels and the snapshot state. You can also turn on this option by clicking ![]() Swap Active Channels and Snapshots on the top toolbar.
Swap Active Channels and Snapshots on the top toolbar.
Clear Channel Snapshots
Clears the snapshot (accepts the updated curve). You can also turn on this option by clicking ![]() Clear Channel Snapshots on the top toolbar.
Clear Channel Snapshots on the top toolbar.
Time Group menu 
A time group is a group of keys that you can easily move through time.
| To... | Do this |
|---|---|
|
Group keys together in a time group |
Make sure you turn on |
|
Add keys to an existing time group |
|
|
Move the keys in a time group together |
Drag the yellow time group line left or right. |
|
Move the time group line without moving the keys |
Drag the time group line with |
|
Delete a time group |
|
Settings menu 
Show Audio in Timeline
When turned on, a graphical representation of the currently loaded audio source is shown in the bottom portion of the graph.
Synchronize Group Selection from Channel List
When turned on, adjusts the channel group selection to match the current channels.
Grid Line Density
Choose the density of the grid or turn the grid off.
Slope Handle Length
Allows you to set the length of the slope handles in the graph. The preset lengths are short, medium, and long. You can also set a custom length by choosing Custom.
Curve Quality
Choose the accuracy of the curves. Lower levels of detail can be faster for very complex graphs. The Straight Lines option does not draw curves, just lines connecting keyframes.
Add Keys
Customizes the behavior in the graph when Alt + ![]() is used to create keys. If set to At Mouse Click Position, the new key on the channel is created at the value where the mouse is in the graph. If set to At Curve Value, the key is created at the current value of the channel.
is used to create keys. If set to At Mouse Click Position, the new key on the channel is created at the value where the mouse is in the graph. If set to At Curve Value, the key is created at the current value of the channel.
Middle Mouse Interaction
Determines how the ![]() interacts with the graph. For the default option Move Keys if Selected, Pan Otherwise:
interacts with the graph. For the default option Move Keys if Selected, Pan Otherwise:
-
If keys are selected, dragging
 anywhere in the graph moves the selected keys along one axis, depending on the direction the keys were first moved.
 -
If no keys are selected, dragging
pans the view.
Toggle Auto-Slope Mode Preference
Toggles the auto-slope preference, which determines whether new keys are created with an automatic slope or an existing slope. See the Set Selected Slopes to Manual/Automatic option.
When the auto-slope preference is set to automatic, new keys that are added to the curve will change the shape of the curve (because Houdini automatically calculates the slope of the key based on the location of the adjacent keys). When the auto-slope preference is set to manual, new keys that are added to the curve will not change the shape of the curve (the slopes of the new keys will be tangent to the curve).
Snap Moved Keys to Nearest Frame
When turned on, keys that are moved in the graph are always moved to an integer frame value in time. You can also turn on this option by clicking ![]() Snap Moved Keys on the top toolbar.
Snap Moved Keys on the top toolbar.
Snap Scaled Keys to Nearest Frame
When turned on, keys that are translated and scaled in the graph (i.e. using the box handle) are always moved to an integer frame value in time.
Bold Non-Integer Keys
When turned on, keys at non-integer frame values in time are drawn in bold and white.
Keep Acceleration Ratios
When turned on, adjusting the acceleration handle on one end of the key also adjusts the acceleration handle on the other end. You can also turn on this option by clicking ![]() Keep Acceleration Ratio on the top toolbar.
Keep Acceleration Ratio on the top toolbar.
Constrain to Axis
When turned on, you can drag and move the key in either time (x) or value (Y). When turned off, you can move the key in both time and value (X and Y) (this is the same functionality as holding ⌃ Ctrl while dragging the key when Constrain to Axis is on).
Reset Channels Settings
Resets all channel settings to their factory default settings.
Values toolbar 
The values toolbar at the bottom of the graph view can be used to change the frame number, keyframe value, slope, acceleration, and segment function of the curves.
Frame, key value, slope and acceleration fields 
The frame, key value, slope and acceleration fields below the graph display information about the selected keyframe/handle. If more than one key or time group is selected, the field displays ---, and editing the field sets the value for all selected keys/handles.
Frame
The frame number of the selected key or time group.
Value
The numeric representation of the selected key’s in or out value.
Slope
| To... | Do this |
|---|---|
|
Change the values of the fields |
Tip You can do simple addition ( + 1.25 …and press Enter. To subtract, add a negative number, for example: + -0.5 |
Function field 
Houdini uses a segment’s function to determine the curve’s behaviour between keyframes. Choose a function from the Function drop-down menu, or type an expression directly in the text box. All of the channels in Houdini are Bezier by default.
Tip
You can set the default curve function for new keyframes in the animation preferences (Edit ▸ Preferences ▸ Animation under Initial Segment).
| Function | Effect |
|---|---|
|
Uses the in value for the entire segment, and jumps to the out value at the end. |
|
|
Generates a straight line between the in and out values, animating the value with uniform speed along the segment. |
|
|
Generates motion that gently accelerates the value at the beginning of the segment and decelerates at the end. The value starts the animation at rest and ends at rest. |
|
|
Generates motion that gently accelerates the value from rest at the beginning of the segment and continues accelerating until the end. |
|
|
Generates motion that gently decelerates the value to rest at the end of the segment. |
|
|
|
These are fundamentally the same as the ease functions, but are raised to the power of 2, resulting in steeper slopes. You can manually change the power in the Function text box (for example, to 3, 4, 5, etc.) to further increase the slope of the curve. |
|
Makes the slope of the out curve equal to the slope of the in curve.
For example, if you change a segment to |
|
|
See the expression reference pages for these functions. |
|
|
Gives you control over the in and out slope. |
|
|
Gives you control over the in and out slope and acceleration. |
|
|
Fits a piecewise polynomial function between the keyframes of consecutive selected segments. |
|
|
Generates a spherical linear interpolation in quaternion space between the in and out values. This function is intended for rotation channels and is the default for rotation channels. Make sure all three rotation channels use Segments with quaternion interpolation are displayed as straight lines in the graph, because their intermediate values expressed as Euler angles are mostly meaningless. You can use the expression To perform a quaternion-based interpolation between two key frames, the |
|
|
Repeats the curve values from the range If the range is longer than the selected segment, only the beginning of the range is used. If the range is shorter than the selected segment, the copied values are repeated throughout the length of the segment. |
|
|
Repeats the curve values from the range If the range is longer than the selected segment, only the beginning of the range is used. If the range is shorter than the selected segment, the copied values are repeated throughout the length of the segment, with each repeated section having its first value set to the last value of the previous section. |