| On this page |
When you select prims from the tree in the Scene Graph Tree pane, you can view information about the selected prims in this pane, similar to how Pixar’s usdview utility works.
The pane is divided into a subpane showing the attributes on the selected prim(s), and secondary subpane with tabs showing the values, metadata, and other info about any attributes you select in the primary subpane.
Toolbar 
|
Tree View |
Show prims and attributes as a tree where the attributes of each prim are listed as children of the prim. |
|
List View |
Show prims and attributes as a spreadsheet, where the prims are rows, and attributes on the prims are columns. |
|
Side-by-side |
Show the primary and secondary subpanes side-by-side. |
|
Top-bottom |
Show the primary and secondary subpanes above-and-below. |
|
Decompose Transforms |
In the spreadsheet view, show Translate, Rotate, and Scale as separate columns. |
|
Filter |
Type in this field to show transforms as T (translate), R (rotate), and S (scale) instead of as a matrix. |
Text colors 
The values are color-coded as in Pixar’s usdview utility.
Grey |
Not set |
Value is not set. |
Orange |
Fallback |
Default values provided by the schema where no value was explicitly set. |
Blue |
Set |
Attribute/primvar value (without time samples). |
Green |
Time sampled |
Animated value (read from time samples). |
Violet |
Value clip |
Time sampled value from a value clip. |
Indigo |
Computed |
Read-only intrinsic or computed values. |
Red |
Relationships |
Pointer to another prim with some relationship to the selected prim(s). |
Tabs 
The Scene Graph Detail right subpane has a total of six tabs with extra information. When you click an entry of the left subpane, you’ll see that only tabs with actual data are active.
The information you get is specific for the primitive you've selected in the Scene Graph Tree.
Value 
The Value tab mirrors the content of the left subpane’s Value column. On the tab, you have access to the entire data. Points are a good example, because objects often consist of several thousands of points. The tab shows a list with the points' numbers and their position data. The data in the column, however, is truncated.
You can also select entries from the tab list.
-
 -click selects a single line.
 -
⌃ Ctrl +
-click selects multiple, non-consecutive lines. -
⇧ Shift +
-click selects multiple, consecutive lines. -
⌃ Ctrl + C copies the selected data to the clipboard (indices are not copied).
Note
The mouse actions and shortcuts are available for all tabs. If a tab has an additional feature, it will be mentioned in the appropriate description.
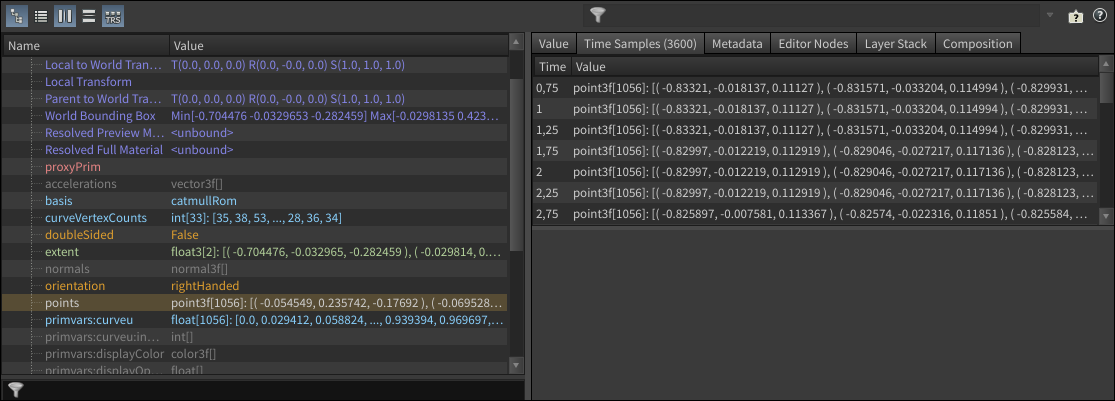
Time Samples 
This tab is the place for inspecting time-dependent attributes and primitives. The Time column shows the current time in seconds. The Value tab contains the values at the specified time. With points, for example, you can trace the changes in position over time or at a specific time. You can also copy the entire data sheet.
-
Select one or more entries. Then
 -click your selection and choose Copy CSV. The data will be copied to the clipboard in CSV format. The abbreviation stands for comma-separated values - a common format for spreadsheet applications.
The tab is also split horizontally and the lower part contains a complete list with values. Look and functionality of this part are the same as with the Value tab.
Metadata 
Here you can see any available metadata for the selected primvar. Again, the panel is split into a Name and a Value column. When you click an entry, you will see additional information in the attached subpane. There you can see the full information, if it should be truncated in the Value column. Some primvars are even documented, for example orientation or visibility.
Editor Nodes 
Here you can see all LOP nodes that made modifications to the selected primitive or property. For example, if you use a ![]() Transform LOP to move or rotate a primitive, it’ll appear in the Editor Nodes tab.
Transform LOP to move or rotate a primitive, it’ll appear in the Editor Nodes tab.
Layer Stack 
This tabs provides information about the selected primitives layer structure and its Scene Graph Tree path. There’s also metadata available, for example about kinds and primitive kinds. When you add a USD file, for example, the Layer column contains the file name.
Composition 
The information on this tab is very USD-specific. Here you can see how layers and composition arcs are combined to define the scene. Experienced users will know how to interpret the data provided.