Houdini 20.0 Executing tasks with PDG/TOPs

Visualizing work item performance

How to visualize the relative cook times (or file output sizes) of work items in the network.

On this page

Overview

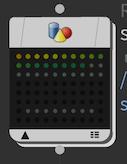
Normally, the work item dots in the network are colored by their current status (for example, cooking, done, error, and so on). You can instead turn on Tasks ▸ Show Task Graph Performance to color the items by their relative cook time to find bottlenecks, or by their output size to find possible runaway output.

The network records each work item’s cook time (and the size of its output files) as the work item cooks. You can turn on Show Performance during the cook to get constantly updating results, or turn it on after the cook to get the final results.

How to

To...Do this

Color work items dots by relative performance data

In the menus at the top of the network editor, turn on Tasks ▸ Show Task Graph Performance.

Show exact cook time

  • Press MMB on a work item to see its exact cook time/output size in the pop-up info window.

  • Show the task graph table to see all exact cook times/output sizes in a table.

Notes

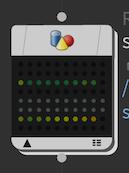
  • The dots are colored along a gradient based on their relative times/sizes. So a work item might be colored red even if it completes very quickly, if all the other items complete even faster.

  • The default work item ordering (“Sort by: Automatic” in the display options) sorts the items by performance when Show Performance is on, so slow items appear before fast items.

    You can use the display options to always sort by State or Index instead.

Executing tasks with PDG/TOPs

Basics

Beginner Tutorials

Next steps

  • Running external programs

    How to wrap external functionality in a TOP node.

  • File tags

    Work items track the results created by their work. Each result is tagged with a type.

  • PDG Path Map

    The PDG Path Map manages the mapping of paths between file systems.

  • Feedback loops

    You can use for-each blocks to process looping, sequential chains of operations on work items.

  • Service Blocks

    Services blocks let you define a section of work items that should run using a shared Service process

  • PDG Services

    PDG services manages pools of persistent Houdini sessions that can be used to reduce work item cooking time.

  • Integrating PDG with render farm schedulers

    How to use different schedulers to schedule and execute work.

  • Visualizing work item performance

    How to visualize the relative cook times (or file output sizes) of work items in the network.

  • Event handling

    You can register a Python function to handle events from a PDG node or graph

  • Tips and tricks

    Useful general information and best practices for working with TOPs.

  • Troubleshooting PDG scheduler issues on the farm

    Useful information to help you troubleshoot scheduling PDG work items on the farm.

  • PilotPDG

    Standalone application or limited license for working with PDG-specific workflows.

Reference

  • All TOPs nodes

    TOP nodes define a workflow where data is fed into the network, turned into work items and manipulated by different nodes. Many nodes represent external processes that can be run on the local machine or a server farm.

  • Processor Node Callbacks

    Processor nodes generate work items that can be executed by a scheduler

  • Partitioner Node Callbacks

    Partitioner nodes group multiple upstream work items into single partitions.

  • Scheduler Node Callbacks

    Scheduler nodes execute work items

  • Custom File Tags and Handlers

    PDG uses file tags to determine the type of an output file.

  • Python API

    The classes and functions in the Python pdg package for working with dependency graphs.

  • Job API

    Python API used by job scripts.

  • Utility API

    The classes and functions in the Python pdgutils package are intended for use both in PDG nodes and scripts as well as out-of-process job scripts.