When using Houdini Engine, Houdini Engine is internally managing a Houdini scene. When a Houdini asset is instantiated inside Maya, Houdini Engine actually instantiates the Houdini asset inside the Houdini scene. When input geometries from Maya are connected to the Houdini asset, the Maya geometry is replicated into the Houdini scene. Asset parameters that are set in Maya are also mirrored in the Houdini scene. Finally, the geometries that the Houdini asset outputs from the Houdini scene are replicated back into Maya. So the internal Houdini scene is at the very core of how Houdini Engine works.
The internals are normally hidden away from users. However, there are times when there is a need to investigate into why an asset isn’t behaving as expected. So being able to inspect the internal Houdini scene can be very useful. This is especially true in cases where an asset is behaving correctly inside Houdini, but behaving correctly through Houdini Engine.
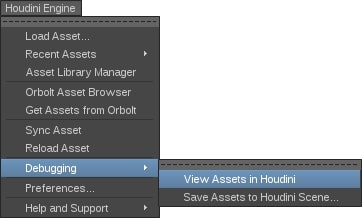
In the Houdini Engine → Debugging menu, there are options to view, or save out, the internal Houdini scene. The internal Houdini scene can then be inspected in a separate Houdini UI session. This is extremely helpful when troubleshooting various Houdini Engine issues. This also means that inspecting the internal Houdini scene requires a license capable of running the Houdini UI.
Another interesting use of this debugging feature is to see exactly what data and metadata is being passed into the Houdini scene when inputting geometry. For example, simply create a null asset and connect a Maya geometry to the asset. The exact data and metadata can then be seen from the Houdini scene. This is much quicker and reliable than checking the documentations.
Another useful workflow is to author assets while viewing this internal Houdini scene. The benefit is that the replicated Maya geometry is immediately available in this Houdini scene. Asset authors can directly test how the Maya geometry would behave in the asset. The author can also have Houdini and Maya running at the same time. Then, the author can make changes to the asset in the Houdini UI, save the asset in the Houdini UI, and reload the asset inside Maya to immediately see the changes.
Houdini Engine Debugger 
In order to use the Houdini Engine Debugger, Maya must connect directly to the debugger session. We do not have an auto-start option for the debugger, so the debugging session needs to be started independently.
To use the Houdini Engine Debugger session
-
First start a Houdini Engine Debugger session in Houdini via Window ▸ Houdini Engine Debugger and start one of session types.
-
In Maya, you will either need to set the session option vars in the script editor before loading the plugin, or you can load the plugin normally, open the Houdini Preferences Window to set the port or pipe name for the Debugger session, and then unload and reload the plugin to start using the debugging session.
e.g. if the debugger has a socket session, on port 9090, set:
optionVar -iv "houdiniEngineSessionType" 1;
optionVar -iv "houdiniEngineThriftPort" 9090;
If the debugger is using a named pipe called “hapi_debug_session”, set:
optionVar -iv "houdiniEngineSessionType" 2;
optionVar -sv "houdiniEngineThriftPipe" "hapi_debug_session";
optionVar -iv "houdiniEngineSessionPipeCustom" 1;
Once connected, any asset instantiated in Maya will also be instantiated in the Houdini session. Parameter values and input geometry will also be reflected in the Houdini scene after cooking. If the user makes a change in Houdini (e.g. parameters, node state, network graph), in order to reflect that change in Maya, the asset definition must be saved in Houdini and reloaded in Maya.
When you are finished with the debugger, reset your preferences back to your normal Back End settings for the next time that you load the plugin.
See the Session section for more detail on how to configure a socket or named pipe session.