-
APEX Add Groom
Adds a groom to an existing APEX Character.
-
APEX Add ML Deformer
Procedurally add a ML Deformer to an APEX rig
-
APEX Add Wrinkles
Procedurally add a Wrinkle Deformer to an APEX rig
-
APEX Animation from Skeleton
Adds animation from a source skeleton to an animation scene.
-
APEX Autorig Builder
Interactively applies and configures rig components in the viewport.
-
APEX Autorig Component
Procedurally adds a rig component to an APEX rig.
-
APEX Build FK Graph
Creates an FK rig APEX graph from skeleton geometry.
-
APEX Configure Character
Configures the character-level properties of an APEX character.
-
APEX Configure Controls
Configures the look and behavior of controls on APEX rigs.
-
APEX Configure Graph
Configure the parameters and bindings for a constraint or component graph.
-
APEX Control Extract
Extracts APEX rig controls to a KineFX skeleton.
-
APEX Control Update Parms
Computes TRS parameters for an APEX rig from a KineFX skeleton.
-
APEX Graph
Directly authors APEX graphs.
-
APEX Invoke Graph
Invokes an APEX graph with the connected inputs, and fetches the results.
-
APEX Layout Graph
Lays out the nodes in an APEX graph.
-
APEX Map Character
Stores a reference on an APEX control to a point in a skeleton geometry.
-
APEX Merge Graph
Merges together two APEX graphs.
-
APEX Pack Character
Packs a character’s skin, rest pose, and animated pose into a character folder structure.
-
APEX Scene Add Animation
Adds animation to an animation scene.
-
APEX Scene Add Character
Adds a new character to an animation scene.
-
APEX Scene Add Prop
Adds a prop with a single control to an animation scene.
-
APEX Scene Animate
Edits the animation on an APEX scene.
-
APEX Scene Copy Animation
Copies the animation in an animation scene.
-
APEX Scene Invoke
Evaluates geometry from an APEX scene.
-
APEX Script
Executes code snippets written with the APEX Script syntax.
-
APEX Unpack Character
Unpacks a character and outputs its skin, capture pose, and animated pose.
-
Adapt to Terrain
Adapts a character’s skeleton to conform to terrain.
-
Adaptive Prune
Removes elements while trying to maintain the overall appearance.
-
Add
Creates Points or Polygons, or adds points/polys to an input.
-
Agent
Creates agent primitives.
-
Agent Animation Unpack
Extracts animation or MotionClips from an agent primitive.
-
Agent Character Unpack
Extracts the rest geometry, skeleton, and animation from an agent primitive.
-
Agent Clip
Adds new clips to agent primitives.
-
Agent Clip Properties
Defines how agents' animation clips should be played back.
-
Agent Clip Transition Graph
Creates geometry describing possible transitions between animation clips.
-
Agent Collision Layer
Creates a new agent layer that is suitable for collision detection.
-
Agent Configure Joints
Creates point attributes that specify the rotation limits of an agent’s joints.
-
Agent Constraint Network
Builds a constraint network to hold an agent’s limbs together.
-
Agent Definition Cache
Writes agent definition files to disk.
-
Agent Edit
Edits the properties of agent primitives.
-
Agent Layer
Adds new shapes and layers to an agent primitive.
-
Agent Look At
Adjusts the agent’s skeleton to look at a target.
-
Agent Metadata
Adds custom data to an agent definition.
-
Agent Pose from Rig
Updates an agent primitive’s pose from a geometry skeleton.
-
Agent Prep
Adds various common point attributes to agents for use by other crowd nodes.
-
Agent Proxy
Provides simple proxy geometry for an agent.
-
Agent Relationship
Creates parent-child relationships between agents.
-
Agent Terrain Adaptation
Adapts agents' legs to conform to terrain and prevent the feet from sliding.
-
Agent Transform Group
Adds new transform groups to agent primitives.
-
Agent Unpack
Extracts geometry from agent primitives.
-
Agent Vellum Unpack
Extracts geometry from agent primitives for a Vellum simulation.
-
Agent from Rig
Creates an agent primitive from a geometry skeleton.
-
Alembic
Loads the geometry from an Alembic scene archive (.abc) file into a geometry network.
-
Alembic Group
Creates a geometry group for Alembic primitives.
-
Alembic Primitive
Modifies intrinsic properties of Alembic primitives.
-
Alembic ROP output driver
-
Armature Capture
Represent a pose as a float point attribute.
-
Armature Deform
Map a pose to a simulated skin.
-
Assemble
Cleans up a series of break operations and creates the resulting pieces.
-
Association Select
Select a single association from a set of associations
-
Attach Joint Geometry
Creates control geometry for SOP-based KineFX rigs.
-
Attribute Adjust Array
Modifies array attribute values.
-
Attribute Adjust Color
Modifies values for a vector-type color attribute on the incoming geometry.
-
Attribute Adjust Dictionary
Modifies dictionary attribute values.
-
Attribute Adjust Float
Modifies floating point attribute values on the incoming geometry.
-
Attribute Adjust Integer
Modifies integer attribute values on the incoming geometry.
-
Attribute Adjust Vector
Modifies values for a vector-type attribute on the incoming geometry.
-
Attribute Blur
Blurs out (or relaxes) points in a mesh or a point cloud.
-
Attribute Cast
Changes the size/precision Houdini uses to store an attribute.
-
Attribute Combine
Combines multiple attributes into a new attribute.
-
Attribute Composite
Composites vertex, point, primitive, and/or
detail attributes between two or more selections.
-
Attribute Copy
Copies attributes between groups of vertices,
points, or primitives.
-
Attribute Create
Adds or edits user defined attributes.
-
Attribute Delete
Deletes point and primitive attributes.
-
Attribute Expression
Allows simple VEX expressions to modify attributes.
-
Attribute Fade
Fades a point attribute in and out over time.
-
Attribute Fill
A low-level node that can solve combinatorial versions of some partial differential equations on an edge-connected point cloud.
-
Attribute From Pieces
Assigns an attribute to points specifying which of a set of models should be copied/instanced to that point, randomly or based on various rules.
-
Attribute Interpolate
Interpolates attributes within primitives or based on explicit weights.
-
Attribute Mirror
Copies and flips attributes from one side of a mirror to the other
side.
-
Attribute Noise
Adds or generates noise in geometry attributes.
-
Attribute Paint
Interactively paint point attributes, such as color or deformation mask values, directly on geometry.
-
Attribute Promote
Promotes or demotes attributes from one geometry level to another.
-
Attribute Randomize
Generates random attribute values of various distributions.
-
Attribute Remap
Fits an attribute’s values to a new range.
-
Attribute Rename
Renames or deletes point and primitive attributes.
-
Attribute Reorient
Modifies point attributes based on differences between two models.
-
Attribute Sort
Sorts a component of an attribute.
-
Attribute String Edit
Edits string attribute values.
-
Attribute Swap
Copies, moves, or swaps the contents of attributes.
-
Attribute Transfer
Transfers vertex, point, primitive, and/or
detail attributes between two models.
-
Attribute Transfer by UV
Transfers attributes between two geometries based on UV proximity.
-
Attribute Transform Compute
Computes transform matrices using vector and matrix point attributes.
-
Attribute Transform Extract
Decomposes transform point attributes into their component pieces and applies an Euler filter to the rotation component
-
Attribute VOP
Runs a VOP network to modify geometry attributes.
-
Attribute Wrangle
Runs a VEX snippet to modify attribute values.
-
Attribute from Map
Samples texture map information to a point attribute.
-
Attribute from Parameters
Creates a dictionary attribute filled with parameter values.
-
Attribute from Volume
Copies information from a volume onto the point attributes of
another piece of geometry, with optional remapping.
-
Bake GSplat
Converts to Houdini’s GSplat Attributes.
-
Bake ODE
Converts primitives for ODE and Bullet solvers.
-
Bake Volume
Computes lighting values within volume primitives
-
Ballistic Path
Generates ballistic projectile paths from the incoming points.
-
Bend
Applies deformations to captured geometry such as bend, twist, taper, and squash/stretch.
-
Blast
Deletes primitives, points, edges or breakpoints.
-
Blend Shapes
Computes a 3D metamorphosis between shapes with the same topology.
-
Block Begin
The start of a looping block.
-
Block Begin Compile
The start of a compile block.
-
Block End
The end/output of a looping block.
-
Block End Compile
The end/output of a compile block.
-
Bone Capture
Supports Bone Deform by assigning capture weights to bones.
-
Bone Capture Biharmonic
Supports Bone Deform by assigning capture weights to points based on biharmonic functions on tetrahedral meshes.
-
Bone Capture Lines
Utility node that supports Bone Capture Biharmonic by creating lines from bones with suitable attributes.
-
Bone Capture Proximity
Supports Bone Deform by assigning capture weights to points based on distance to bones.
-
Bone Deform
Uses capture attributes created from bones to deform geometry according to their movement.
-
Bone Link
Creates default geometry for Bone objects.
-
Boolean
Combines two polygonal objects with boolean operators, or finds the intersection lines between two polygonal objects.
-
Boolean Fracture
Fractures the input geometry using cutting surfaces.
-
Bound
Creates a bounding box, sphere, or rectangle for the input geometry.
-
Box
Creates a cube or six-sided rectangular box.
-
Bulge
Deforms the points in the first input using one or more magnets
from the second input.
-
COP Network
Imports COP network layers as geometry.
-
COP Preview Material
Applies a preview material to geometry.
-
COP2 Network
Imports 2d geometry from a Composite network.
-
Cache
Records and caches its input geometry for faster playback.
-
Cache If
Chooses whether to cook the input or re-use cached output based on configurable conditions.
-
Capture Attribute Pack
Converts array attributes into a single index-pair capture attribute.
-
Capture Attribute Unpack
Converts a single index-pair capture attribute into per-point and detail array attributes.
-
Capture Correct
Adjusts capture regions and capture weights.
-
Capture Layer Paint
Lets you paint capture attributes directly onto geometry.
-
Capture Mirror
Copies capture attributes from one half of a symmetric model to the other.
-
Capture Override
Overrides the capture weights on individual points.
-
Capture Packed Geometry
Rigidly captures packed geometry to a SOP skeleton.
-
Capture Region
Supports Capture and Deform operation by creating a volume within which
points are captured to a bone.
-
Carve
Slices, cuts or extracts points or cross-sections from a
primitive.
-
Chain
Repeats one or more pieces of geometry along a curve.
-
Channel
Reads sample data from a chop and converts it into point positions
and point attributes.
-
Channel Primitives from MotionClip
Generates a collection of channel primitives from a MotionClip geometry.
-
Character Blend Shape Channels
Creates node parameters and/or detail attributes on the character’s skeleton to drive its blend shapes.
-
Character Blend Shapes
Applies blend shapes to a KineFX character’s geometry using the weight attributes on its skeleton.
-
Character Blend Shapes Add
Adds blend shapes to a character’s skin geometry.
-
Character Blend Shapes Extract
Outputs one of a character mesh’s blend shapes.
-
Character I/O
Packs Character mesh, capture pose and animation, saves them to disk, and loads them back again.
-
Character Pack
Creates a packed geometry primitive from a rest geometry, skeleton, and animation inputs.
-
Character Unpack
Extracts the rest geometry, skeleton, and animation from an packed geometry primitive.
-
Circle
Creates open or closed arcs, circles and ellipses.
-
Circle Spline
Evaluate and resample blended interpolating splines defined by one or more control polygons.
-
Circle from Edges
Transforms selected geometry into a circle.
-
Clean
Helps clean up dirty models.
-
Clip
Removes or groups geometry on one side of a plane,
or creases geometry along a plane.
-
Cloth Capture
Captures low-res simulated cloth.
-
Cloth Deform
Deforms geometry captured by the Cloth Capture SOP.
-
Cloud Adjust Density Profile
Controls the volume density based on a signed distance field.
-
Cloud Billowy Noise
Applies a billowy cloud like displacement noise to a fog volume.
-
Cloud Clip
Splits a fog volume in half using a clipping plane.
-
Cloud Light
Fills a volume with a diffuse light.
-
Cloud Noise
Applies a cloud like noise to a Fog volume.
-
Cloud Shape Generate
Creates primitive spheres used to model cumulus cloud-like shapes.
-
Cloud Shape Replicate
Generates primitive spheres used to model cumulus cloud-like shapes around existing primitive spheres.
-
Cloud Shape from Intersection
Creates primitive spheres used to model cumulus cloud-like shapes at geometry intersection.
-
Cloud Shape from Line
Creates primitive spheres used to model cumulus cloud-like shapes around a line primitive.
-
Cloud Shape from Polygon
Fills a polygonal mesh with adaptively-sized primitive spheres used to model cumulus cloud-like shapes.
-
Cloud Wispy Noise
Applies thin feathery like fine displacement noise to a fog volume.
-
Cluster
Low-level machinery to cluster points based on their positions (or any vector attribute).
-
Cluster Points
Higher-level node to cluster points based on their positions (or any vector attribute).
-
Collision Source
Creates geometry and VDB volumes for use with DOPs collisions.
-
Color
Adds color attributes to geometry.
-
Comb
Adjust surface point normals by painting.
-
Compute Rig Pose
Evaluates a multiparm of transform parameters and applies them to the input skeleton.
-
Compute Transform
Recomputes world space or local space transforms for points in a hierarchy.
-
Configure Clip Info
Edits properties of a skeleton animation or motion clip.
-
Configure Joint Limits
Configures joint rotation and translation limits.
-
Configure Joints
Configures joint properties like local center of mass and transformation limits and creates a center of mass joint.
-
Configure Rig Vis
Determines which input skeleton components are visible for a KineFX character.
-
Connect Adjacent Pieces
Creates lines between nearby pieces.
-
Connectivity
Creates an attribute with a unique value for each set of connected primitives or points.
-
Control
Creates simple geometry for use as control shapes.
-
Convert
Converts geometry from one geometry type to another.
-
Convert HeightField
Converts a 2D height field to a 3D VDB volume, polygon surface, or polygon soup surface.
-
Convert Line
Converts the input geometry into line segments.
-
Convert Meta
Polygonizes metaball geometry.
-
Convert Tets
Generates the oriented surface of a tetrahedron mesh.
-
Convert VDB
Converts sparse volumes.
-
Convert VDB Points
Converts a Point Cloud into a VDB Points Primitive, or vice versa.
-
Convert Volume
Converts the iso-surface of a volume into a polygonal surface.
-
Convex Decomposition
Decomposes the input geometry into approximate convex segments.
-
Copy and Transform
Copies geometry and applies transformations to the copies.
-
Copy to Curves
Copies geometry in the first input onto curves of the second input.
-
Copy to Points
Copies geometry in the first input onto the points of the second input.
-
Crease
Manually adds or removes a creaseweight attribute to/from polygon
edges, for use with the Subdivide SOP.
-
Cross Section Surface
Creates a surface around cross sections.
-
Crowd Assign Layers
Assigns layers to a crowd to produce geometry variations.
-
Crowd MotionPath
Creates motion paths from a crowd’s animation clips or a simulation.
-
Crowd MotionPath Arcing Layer
Blends between a set of animation clips based on the motion path’s turn rate.
-
Crowd MotionPath Avoid
Deforms motion paths to avoid other agents and obstacles.
-
Crowd MotionPath Edit
Deforms motion paths to match target positions.
-
Crowd MotionPath Evaluate
Evaluates motion paths at a specific frame.
-
Crowd MotionPath Follow
Deforms motion paths to follow guiding curves.
-
Crowd MotionPath Layer
Layers additional animation clips onto an agent’s motion path.
-
Crowd MotionPath Retime
Adjusts the timing of motion paths.
-
Crowd MotionPath Transition
Blends an agent’s motion path into a new animation clip.
-
Crowd MotionPath Trigger
Defines a trigger that can be used to activate transitions between animation clips.
-
Crowd Source
Populates a crowd of agent primitives.
-
Curve
Lets you interactively draw Bézier curves using tools similar to 2D illustration programs, as well as polylines and NURBS.
-
Curve Intersect
Finds the intersections (or points of minimum distance) between two
or more curves or faces.
-
DOP Import
Imports geometry or transforms from a DOP simulation.
-
DOP Import Fields
Imports scalar and vector fields from a DOP simulation.
-
DOP Import Records
Imports option and record data from DOP simulations into points with
point attributes.
-
DOP Network
-
Debris Source
Generates point emission sources for debris, pyro, or particle sources from separating fractured rigid body objects.
-
Deflate
Deflate regions of a mesh.
-
Deformation Wrangle
Runs a VEX snippet to deform geometry.
-
Delete
Deletes input geometry by group, entity number, bounding volume,
primitive/point/edge normals, and/or degeneracy.
-
Delete Joints
Delete Joints on a SOP Rig.
-
DeltaMush
Smooths out (or relaxes) point deformations.
-
Dem Bones Skinning Converter
Converts any non-changing topology deforming mesh sequence into a bone-based animation.
-
Dem Bones Skinning Converter
Generates and assigns capture weights to points based on the Smooth Skinning Decomposition with Rigid Bones algorithm.
-
Detangle
Attempts to prevent collisions when deforming geometry.
-
Dissolve
Removes edges from the input polygonal geometry merging polygons with
shared edges.
-
Distance along Geometry
Measures the distance of the shortest path along the geometry’s edges or surfaces from each start point.
-
Distance from Geometry
Measures distance between each point and a reference geometry.
-
Distance from Target
Measures distance of each point from a target.
-
Divide
Divides, smooths, and triangulates polygons.
-
Draw Curve
Creates a curve based on user input in the viewport.
-
Draw Guides
-
Dynamic Warp
Dynamically Time-warps the first input (the Source) using the second input
(the Reference) as a reference.
-
Each
Culls the input geometry according to the specifications of the
For Each SOP.
-
Edge Collapse
Collapses edges and faces to their centerpoints.
-
Edge Cusp
Sharpens edges by uniquing their points and recomputing point
normals.
-
Edge Divide
Inserts points on the edges of polygons and optionally connects them.
-
Edge Equalize
Transforms selected edges so that all edges are of equal length.
-
Edge Flip
Flips the direction of polygon edges.
-
Edge Fracture
Cuts geometry along edges using guiding curves.
-
Edge Relax
Moves points such that edge lengths match a reference.
-
Edge Straighten
Straightens selected edges.
-
Edge Transport
Copies and optionally modifies attribute values along edges networks and curves.
-
Edit
Edits points, edges, or faces interactively.
-
Ends
Closes, opens, or clamps end points.
-
Enumerate
Sets an attribute on selected points or primitives to sequential numbers or strings.
-
Error
Generates a message, warning, or error, which can show up on a parent asset.
-
Exploded View
Pushes geometry out from the center to create an exploded view.
-
Export Object Transforms
Export transform attributes to object nodes.
-
Extract Centroid
Computes the centroid of each piece of the geometry.
-
Extract Contours
Extracts the contour edges of the input geometry as viewed from a perspective camera
-
Extract Locomotion
Extracts translation and orientation from a character using a given input joint.
-
Extract Point from Curve
Creates new points where an interpolated attribute has a certain value on a curve.
-
Extract T-Pose
Extracts the t-pose position from the input bone, muscle, or tissue geometry.
-
Extract Transform
Computes the best-fit transform between two pieces of geometry.
-
Extrude
Extrudes geometry along a normal.
-
Extrude Volume
Extrudes surface geometry into a volume.
-
FBIK Configure Targets
Configures joint properties used by full-body inverse kinematics solvers.
-
FBX Animation Import
Imports animation from an FBX file as a geometry-based skeleton.
-
FBX Character Import
Imports a skinned character with animation from an FBX file.
-
FBX Skin Import
Imports skin geometry from an FBX file.
-
FEM Deform
Deforms a solid piece of geometry (tetrahedral mesh) using the FEM quasistatic solver.
-
FEM Validate
Visualizes the quality of a tetrahedral mesh.
-
FEM Visualize
-
FK Transfer
Transfer forward kinematic motion to a SOP-based skeleton
-
FLIP Boundary
Creates a surface or density VDB for sourcing or deleting SOP FLIP fluid particles.
-
FLIP Collide
Converts connected geometry and volumes into collision object for SOP FLIP fluids.
-
FLIP Container
Creates a domain for a SOP FLIP fluid simulation.
-
FLIP Solver
Evolves an object as a FLIP fluid object inside a SOP network.
-
FLIP Source
Creates a surface or density VDB for sourcing FLIP simulations.
-
FLIP Volume Combine
Combine FLIP fields of different resolutions.
-
Facet
Controls the smoothness of faceting of a surface.
-
Feather Barb Tangents
Computes tangent space information for the surface spanned by barbs.
-
Feather Barb Transform
Transform barb vectors between feather space and object space.
-
Feather Clump
Clumps/Splits the barbs of a feather.
-
Feather Deform
-
Feather Deintersect
Moves intersecting feathers apart.
-
Feather Instance Pool
Creates a feather primitive for each combination of template weights found in the input curves.
-
Feather Match Uncondensed
Transfers attributes from uncondensed (expanded) feathers to single-curve feathers.
-
Feather Minimum Distance
Finds the closest point to each barb point on another geometry.
-
Feather Noise
Adds noise to the barbs of a feather. The noise amount can be controlled separately along each axis (along normal, tangent, or bitangent).
-
Feather Normalize
Normalizes the length and straightens feathers.
-
Feather Primitive
Generates feather primitives (Agent primitives with GPU-skinning).
-
Feather Ray
For each point on a feather, find the closest point on some other geometry.
-
Feather Resample
Resamples the shaft or barbs of a feather.
-
Feather Shape Organize
Organizes loosely drawn curves by name, so they can be input into Feather Template from Shape.
-
Feather Surface
Converts feather primitives to polygon surfaces.
-
Feather Surface Blend
Makes feather follow the curvature of a polygon mesh.
-
Feather Template Assign
Assigns feather templates from the second input to curves in the first input.
-
Feather Template Interpolate
Blends the barb values of a set of template curves.
-
Feather Template from Shape
Generates a feather template from shape curves.
-
Feather Uncondense
Expands the virtual barbs on feather curves to real curve primitives.
-
Feather Utility
Provides a collection of helpful functions for working with feather curves.
-
Feather Visualize
Changes the visualization of feathers in the viewport.
-
Feather Width
Sets the curve widths of feather shaft and barbs.
-
Fiber Groom
Defines the fiber direction vector for input solid muscle geometry.
-
Filament Advect
Evolves polygonal curves as vortex filaments.
-
File
Reads, writes, or caches geometry on disk.
-
File Cache
Caches (writes out once and then reads from) geometry (possibly animated) to disk.
-
File Cache
Caches (writes out once and then reads from) geometry (possibly animated) to disk.
-
File Cache
Caches (writes out once and then reads from) geometry (possibly animated) to disk.
-
File Merge
Reads and collates data from disk.
-
Filmbox FBX ROP output driver
-
Find Instances
Find instances of the same geometry pieces and replace them with packed geometry instances.
-
Find Shortest Path
Finds the shortest paths from start points to end points, following the edges of a surface.
-
Flatten
Flattens 3D geometry onto a plane.
-
Fluid Compress
Compresses the output of fluid simulations to decrease size on disk
-
Font
Creates 3D text from Type 1, TrueType and OpenType fonts.
-
Force
Uses a metaball to attract or repel points or springs.
-
Fractal
Creates jagged mountain-like divisions of the input
geometry.
-
Franken Muscle
Assigns multiple muscle_id identities within a single muscle geometry.
-
Franken Muscle Paint
Modifies muscle_id identities within a Franken Muscle using a paint interface.
-
Full Body IK
Transfer a motion to a SOP-based skeleton using full-body inverse kinematics algorithm.
-
Fur
Creates a set of hair-like curves across a surface.
-
Fuse
Merges or snaps points.
-
GLTF Animation Import
Imports animation data from a glTF file as a geometry-based skeleton.
-
GLTF Character Import
Imports a skinned character with animation from a glTF file.
-
GLTF Skin Import
Imports skin geometry from a glTF file.
-
Gaea Terrain Color Visualizer
This utility tool allows you to switch between RGB and Mask visualization on Terrains.
-
Gaea Terrain Processor
This bridge allows you to run .terrain files from Gaea inside Houdini.
-
Glue Cluster
Adds strength to a glue constraint network according to cluster
values.
-
Grain Source
Generates particles to be used as sources in a particle-based grain simulation.
-
Graph Color
Assigns a unique integer attribute to non-touching components.
-
Grid
Creates planar geometry.
-
Groom Blend
Blends the guides and skin of two grooms.
-
Groom Fetch
Fetches groom data from grooming objects.
-
Groom Pack
Packs the components of a groom into a set of named Packed Primitives for the purpose of writing it to disk.
-
Groom Switch
Switches between all components of two groom streams.
-
Groom Unpack
Unpacks the components of a groom from a packed groom.
-
Group
Generates groups of points, primitives, edges, or vertices according to various criteria.
-
Group Combine
Combines point groups, primitive groups, or edge groups according to boolean operations.
-
Group Copy
Copies groups between two pieces of geometry.
-
Group Delete
Deletes groups of points, primitives, edges, or vertices according to patterns.
-
Group Expand
Expands or shrinks groups of Edges, Points, Primitives, or Vertices.
-
Group Expression
Runs VEX expressions to modify group membership.
-
Group Find Path
Constructs groups for paths between elements.
-
Group Invert
Invert point, primitive, edge, or vertex groups.
-
Group Joints
Group Joints on a SOP Rig.
-
Group Paint
Sets group membership interactively by painting.
-
Group Promote
Converts point, primitive, edge, or vertex groups into point, primitive, edge, or vertex groups.
-
Group Range
Groups points and primitives by ranges.
-
Group Rename
Renames groups according to patterns.
-
Group Transfer
Transfers groups between two pieces of geometry, based on
proximity.
-
Group by Lasso
Groups points and primitives by lasso.
-
Group from Attribute Boundary
Creates a group that includes the boundaries of the specified attribute.
-
Groups from Name
Creates group for each unique name and adds elements to that group.
-
Guide Advect
Advects guide points through a velocity volume.
-
Guide Clump Center
Generates center curves representing each guide clump.
-
Guide Collide With VDB
Resolves collisions of guide curves with VDB signed distance fields.
-
Guide Deform
Deforms geometry with an animated skin and optionally guide curves.
-
Guide Fill
Adds guides to points lacking corresponding guides based on a Guide Interpolation Mesh.
-
Guide Find Strays
Identifies stray guide curves based on root distance and other metrics.
-
Guide Groom
Interactively creates and modifies guide curves.
-
Guide Group
Creates standard primitive groups used by grooming tools.
-
Guide Initialize
Quickly give hair guides some initial direction.
-
Guide Interpolation Mesh
Given a set of guide curves and a skin mesh, generates a mesh that can
be used to interpolate guide curve influences at any point.
-
Guide Mask
Creates masking attributes for other grooming operations.
-
Guide Partition
Creates and prepares parting lines for use with hair generation.
-
Guide Process
Modifies guide or hair using one or more operations.
-
Guide Skin Attribute Lookup
Looks up skin geometry attributes under the root point of guide curves.
-
Guide Surface
Positions points on a triangulated mesh based on guide or fur curves.
-
Guide Tangent Space
Constructs a coherent tangent space along a curve.
-
Guide Transfer
Transfer hair guides between geometries.
-
Guide Volume
Generates volumetric representations from guide curves.
-
Hair Card Generate
Converts dense hair curves to a polygon card, keeping the style and shape of the groom.
-
Hair Clump
Clumps guide curves together.
-
Hair Generate
Generates hair on a surface or from points.
-
Hair Growth Field
Generates a velocity field based on stroke primitives.
-
Heat Geodesic
Measures the distance of each point to a group of source points along a polygonal surface.
-
HeightField
Generates an initial heightfield volume for use with terrain tools.
-
HeightField Blur
Blurs a terrain height field or mask.
-
HeightField Clip
Limits height values to a certain minimum and/or maximum.
-
HeightField Copy Layer
Creates a copy of a height field or mask.
-
HeightField Crop
Extracts a square of a certain width/length from a larger height volume, or resizes/moves the boundaries of the height field.
-
HeightField Cutout by Geometry
Creates a cutout on a terrain based on geometry.
-
HeightField Deform
Deforms geometry by a changing HeightField
-
HeightField Distort by Layer
Displaces a height field by another field.
-
HeightField Distort by Noise
Advects the input volume through a noise pattern to break up hard edges and add variety.
-
HeightField Draw Mask
Lets you draw shapes to create a mask for height field tools.
-
HeightField Erode
Simulates hydraulic and thermal erosion at a specific scale to create more realistic terrain.
-
HeightField Erode Hydro
Simulates the erosion from one heightfield sliding over another for a short time.
-
HeightField Erode Precipitation
Distributes water along a heightfield. Offers controls for adjusting the intensity, variability, and location of rainfall.
-
HeightField Erode Thermal
Calculates the effect of thermal erosion on terrain for a short time.
-
HeightField File
Imports a 2D image map from a file or compositing node into a height field or mask.
-
HeightField Flatten
Flattens a masked region of a heightfield terrain.
-
HeightField Flow Field
Generates flow and flow direction layers according to the input height layer.
-
HeightField Isolate Layer
Copies another layer over the mask layer, and optionally flattens the height field.
-
HeightField Layer
Composites together two height fields.
-
HeightField Layer Clear
Sets all values in a heightfield layer to a fixed value.
-
HeightField Layer Properties
Sets the border voxel and compression policies on a height field volume.
-
HeightField Mask by Feature
Creates a mask based on different features of the height layer.
-
HeightField Mask by Geometry
Creates a mask based some other geometry.
-
HeightField Mask by Occlusion
Creates a mask where the input terrain is hollow/depressed, for example riverbeds and valleys.
-
HeightField Noise
Adds vertical noise to a height field, creating peaks and valleys.
-
HeightField Output
Exports height and/or mask layers to disk as an image.
-
HeightField Paint
Lets you paint values into a height or mask field using strokes.
-
HeightField Patch
Patches features from one heightfield to another.
-
HeightField Pattern
Adds displacement in the form of a ramps, steps, stripes, Voronoi cells, or other patterns.
-
HeightField Project
Projects 3D geometry into a height field.
-
HeightField Quick Shade
Applies a material that lets you plug in textures for different layers.
-
HeightField Remap
Remaps the values in a height field or mask layer.
-
HeightField Resample
Changes the resolution of a height field.
-
HeightField Scatter
Scatters points across the surface of a height field.
-
HeightField Slump
Simulates loose material sliding down inclines and piling at the bottom.
-
HeightField Terrace
Creates stepped plains from slopes in the terrain.
-
HeightField Tile Splice
Stitches height field tiles back together.
-
HeightField Tile Split
Splits a height field volume into rows and columns.
-
HeightField Transform
Height field specific scales and offsets.
-
HeightField Visualize
Visualizes elevations using a custom ramp material, and mask layers using tint colors.
-
Hole
Makes holes in surfaces.
-
IK Chains
Creates and evaluates Two-Bone IK solvers on a SOP skeleton.
-
Inflate
Deforms the points in the first input to make room for the
inflation tool.
-
Instance
Instances Geometry on Points.
-
Intersection Analysis
Creates points with attributes at intersections between triangles and/or polygon curves, either within a single input geometry or between a first and a second input geometry.
-
Intersection Stitch
Composes triangle surfaces and curves together into a single connected mesh.
-
Invoke Compiled Block
Processes its inputs using the operation of a referenced compiled block.
-
Invoke Graph
Processes its inputs using operations defined by a geometry graph.
-
IsoOffset
Builds an offset surface from geometry.
-
Join
The Join op connects a sequence of faces or surfaces into a single
primitive that inherits their attributes.
-
Joint Capture Biharmonic
Captures skin geometry to a SOP skeleton for use with Joint Deform.
-
Joint Capture Paint
Lets you paint capture weights directly onto geometry.
-
Joint Capture Proximity
Supports Joint Deform by assigning capture weights to points based on distance to joints.
-
Joint Deform
Perform skin deformation from KineFX skeleton animation.
-
Kelvin Wakes Deformer
Deforms input geometry in the shape of water wakes that form behind objects
moving at a constant speed.
-
L-System
Creates fractal geometry from the recursive application of simple rules.
-
LOP Import
-
Labs 2D Wave Function Collapse
The main WFC node: The solver.
-
Labs AV Analyze Images
Match all features between candidate image pairs using Alicevision.
-
Labs AV Depth Map
Retrieves the depth value of each pixel from the cameras using Alicevision.
-
Labs AV Initialize
Configure which images to process using Alicevision.
-
Labs AV Meshing
Creates a dense geometric surface representation of the scene using Alicevision.
-
Labs AV Photogrammetry
The complete Alicevision photogrammetry pipeline.
-
Labs AV Structure from Motion
Detects 3D points with position and orientation and calibrate the cameras accordingly using Alicevision.
-
Labs AV Texturing
Texture the generated mesh using Alicevision.
-
Labs Align and Distribute
Aligns and arranges geometry pieces in linear or grid layouts.
-
Labs Attribute Value Replace
Allows you to replace attribute values with others.
-
Labs Auto UV
Automatically Generates UV Attributes
-
Labs Automatic Trim Texture
Automatic Trim Texturing node.
-
Labs Biome Attributes Evolve (Beta)
Evolve all the attributes on the terrain to create more realistic results.
-
Labs Biome Curve Label (Beta)
This node sets the necessary attributes on curves created in Houdini to use with Labs Biome Region Assign SOP.
-
Labs Biome Define (Beta)
Define the biome attributes.
-
Labs Biome Define (Beta)
Define the biome attributes for the Biome Toolset.
-
Labs Biome Definitions File (Beta)
This node reads biome information from the disk file or writes to the disk file from input Biome Define SOP nodes.
-
Labs Biome Plant Define (Beta)
Defines the plant attributes for the Biome Toolset.
-
Labs Biome Plant Definitions File (Beta)
This node reads plant information from the disk file or writes to the disk file from input Biome Plant Define SOP nodes.
-
Labs Biome Plant Scatter (Beta)
Scatters plant species points across the surface of an input heightfield by matching input plant types with their preferred environmental conditions.
-
Labs Biome Region Assign (Beta)
Delineates biome regions for the Biome Toolset workflow.
-
Labs Boolean Curve
Does a boolean on a polycurve.
-
Labs Box Clip
Clip geometry to a resizable box region.
-
Labs Boxcutter
Viewport interactive boolean for hardsurface modeling.
-
Labs Building Generator
Converts low-resolution blockout geometry into detailed buildings using a library of user defined modules.
-
Labs Building Generator Utility
Create base modules to use with the building generator, as well as override base module behavior.
-
Labs Building from Patterns
Creates buildings from blockout geometry defined by a pattern of floor modules.
-
Labs CSV Exporter
Export geometry attibutes to a CSV file.
-
Labs Cable Generator
Creates and simulates cables based on curve or geometry input.
-
Labs Calculate Slope
Calculate the slope of a surface by comparing to a direction, and optionally blur and remap the result.
-
Labs Calculate Thickness
Vertex Based Thickness Calculation
-
Labs Calculate UV Distortion
Calculate UV distortion of a piece of geometry
-
Labs Capsule
Generates a capsule mesh.
-
Labs Chaotic Shapes
Generates different chaotic maps.
-
Labs Clean Seams
Removes from an edge group all the edges that are not borders between different primitive islands identified by an island attribute.
-
Labs Color Blend
Blends Color data on 2 separate meshes based on common algorithms
-
Labs Connectivity and Segmentation
This node segments geometry based on connectivity, UV islands, proximity clustering, and custom attributes. This is very useful when paired with the multithreaded functionality of compile blocks.
-
Labs Cook with Timeout
Documentation coming soon…
-
Labs Coord Swizzle Quaternion
Swizzles Quaternions in order to change rotation spaces
-
Labs Coord Swizzle Vector
Reorders Vector Components
-
Labs Curve Branches
Scatters curves over curves, with many intuitive controls to go from clean geometric branches to organic vines. Duplicates of this sop can be chained together for recursive growth, approximating the look of L-Systems but much more controllable.
-
Labs Curve Resample by Density
Redistributes curve points based on density.
-
Labs Cylinder
Create a tube from a curve, with UVs and normals.
-
Labs Decal Projector
Project a decal (localized piece of geometry and a texture) onto geometry.
-
Labs Delete Small Parts
Removes pieces based on connectivity and size
-
Labs Delight
Remove light and shadow variation from photogrammetry textures.
-
Labs Destruction Cleanup
Prepare rigid body simulation results for export, reducing redundant geometry, cleaning normals, cleaning attributes.
-
Labs Detail Mesh
The Detail Mesh SOP allows you to project a so called detail mesh onto template geometry.
-
Labs Dirt Skirt
Create a geometry 'skirt' where an object and ground plane intersect, to be used as a soft blend in a game engine.
-
Labs Disc
Create a polygon disc with UVs
-
Labs Dissolve Flat Edges
Remove edges on flat surfaces.
-
Labs Distance From Border
Calculates the distance for each point from the nearest unshared edge
-
Labs Edge Color
Color sharp edges on geometry
-
Labs Edge Damage
Adding procedural damage on inputs
-
Labs Edge Group To Curve
Converts an Edge Group to a Poly Curve
-
Labs Edge Group to Polylines
Converts edge groups to polylines.
-
Labs Edge Smooth
Smooth an edge-group found in input geometry.
-
Labs Export UV Wireframe
Allows you to export the UV wireframe for texturing
-
Labs Extract Borders
Extract curves from Meshes
-
Labs Extract Filename
Utility SOP to store the filename of a file SOP as its detail attributes to be then used in other SOPs.
-
Labs Extract Silhouette
Create an outline of an object projected from either an axis, or from a camera.
-
Labs FBX Archive Import
Import an FBX as an archive similar to how the Alembic Archive sop works.
-
Labs Fast Remesh
This node performs Houdini’s native remeshing operation on partitioned geometry, processing each piece in parallel which greatly reduces the calculation time of traditional remeshing.
-
Labs Flowmap
This utility tool sets up a flowmap template on your input geometry.
-
Labs Flowmap Obstacle
The flowmap obstacle SOP allows for easy modifications on the flowmap based on geometry.
-
Labs Flowmap Shader
The flowmap SHOP is a GLSL based viewport shader to preview flowmap shaders.
-
Labs Flowmap Visualize
A high quality realtime preview of a flowmap texture in the Houdini viewport.
-
Labs Flowmap to Color
The flowmap to color SOP converts the flowmap data to vertex colors
-
Labs GameRes
Full Pipeline Node to Take High Res Models to Low Res
-
Labs Games Baker
Generate Textures based on a High Poly to Low Poly match
-
Labs Gas Expand from Temperature
Creates divergence from temperature change.
-
Labs Gas Flamefront
A simple flamefront combustion model.
-
Labs GoZ Export
Sends Houdini Mesh data automatically to Zbrush
-
Labs GoZ Import
Contains GoZ data sent from Zbrush
-
Labs Group Curve Corners
Creates Groups for Inside and Outside corner points
-
Labs Group Invert
Invert any number of specified groups
-
Labs Group by Attribute
Converts Attributes to Groups
-
Labs Group by Measure
Allows for grouping geometry based on properties that can be measured
-
Labs Guide Flowmap
The Guide Flowmap modifies a flowmap based on a guide curve.
-
Labs HF Combine Masks
Simplifies the process of blending masks together in Heightfields
-
Labs HF Insert Mask
Allows you to insert a layer from another heightfield.
-
Labs Hexagon Grid
Generates a hexagonal grid.
-
Labs Houdini Icon
Geometric representation for Houdini icon
-
Labs Impostor Camera Rig
This OBJ sets up a camera rig to be used with the Impostor Texture ROP
-
Labs Impostor Texture
The impostor tool creates texture sheets to fake 3D objects in your game engine.
-
Labs Inside Face UVs
Create UV’s for inside faces of Voronoi fractured geometry.
-
Labs Instance Attributes
Summary.
-
Labs Instant Meshes
This tool allows you to run geometry through InstantMeshes and generate a quad mesh.
-
Labs LOD Create
The LOD Create SOP allows for easy LOD generation.
-
Labs LOD Hierarchy
Create and export an LOD Hierarchy as FBX
-
Labs Lightning
Generate lightning effect around meshes
-
Labs Loop Volume
Takes one or two input volume sequences and creates a seamlessly looping volume animation.
-
Labs Loops from Selection
Finds edge loops or quad loops from manually or procedurally selected start edges.
-
Labs Lot Subdivision
Divides polygons into panels.
-
Labs ML CV Directory Import
Imports the assets from a directory.
-
Labs ML CV Keypoint Metadata
Prepares the keypoint metadata.
-
Labs ML CV Label Metadata
Prepares the label metadata.
-
Labs ML CV Promote Synth Attribute
Converts an attribute into a format compatible with COCO JSON.
-
Labs ML CV ROP Annotation Output
Outputs a ground truth JSON per frame and then aggregates them all into a COCO JSON file for the full dataset.
-
Labs ML CV Texture Mask
Adds geometry attributes needed for the mask ground truth pipeline.
-
Labs ML CV Vector Data
Creates the ground truth for 3D vectors.
-
Labs ML CV Visualize Keypoints
Visualizes keypoints and their connections.
-
Labs Make Loop
Takes a mesh or volume that is animated and loops them.
-
Labs Maps Baker
Generates textures bakes from a high resolution to low resolution model at near interactive speeds.
-
Labs Material to Override
Generates material_override attributes per primitive based on the assigned material.
-
Labs Measure Curvature
Measures the convex and concave curvature of a model.
-
Labs Merge Small Islands
Consolidates Small UV Islands into Larger Neighbors
-
Labs Merge Splines
Merges disconnected Polylines together like the Polypath Sop, cutting them at intersections.
But with specified conditions, while preserving and merging attributes and groups.
-
Labs Mesh Sharpen
Sharpens the geometry based on curvature
-
Labs Mesh Slice
Clips the geometry into multiple submeshes based on a 3d grid pattern
-
Labs Mesh Tiler
Makes packed geometry lying on a plane tileable.
-
Labs Min Max Average
Multiple Min/Max/Average analyses in a single node.
-
Labs Motionvector Shader
Viewport shader for motion vector textures
-
Labs Multi Bounding Box
Generate Several Bounding Boxes For the Input Mesh
-
Labs Name from Capture Weight
Detects what the bone name of the highest skinning weight influence is.
-
Labs Niagara ROP
Export point caches to be used with Unreal’s Niagara particle system.
-
Labs OBJ Importer
Import an OBJ File including its materials and textures.
-
Labs OSM Buildings
Generate Buildings from OSM Data
-
Labs OSM Filter
Isolates Specific OSM Data Layers
-
Labs OSM Import
Imports Open Street Map Data
-
Labs PBR Shader
Physically Based Viewport Shader
-
Labs PCG Export (Beta)
Takes a point cloud with attributes and exports them as 2 CSV files to be used with Unreal Engine PCG system.
-
Labs PDG Work-Item Import
Import input and output files attached to a work-item in PDG
-
Labs Path Deform
Deform geometry along a curve.
-
Labs Pathfinding Global (Beta)
This node creates paths between points of interest on a given terrain based on cost and avoidance attributes.
-
Labs Physical Ambient Occlusion
Computes ambient occlusion, generates dirt masks, as well as identifies peaks and valleys on meshes.
-
Labs Physics Painter
Physics Painter is a SOP that allows users to paint physics objects onto any other object.
-
Labs Pick and Place
Allows you to interactively place individual objects in a scene.
-
Labs PolyDeform
Warps a source mesh to match the shape of a target
-
Labs PolyScalpel
Slices new polygonal edges or points into the primary input geometry from the secondary input in various configurations.
-
Labs PolySlice
Slice polygons into polygons or polylines
-
Labs Post Animation Deform
Apply modeling changes to deforming geometry
-
Labs Procedural Smoke
The procedural smoke SOP will generate an animated volume to represent smoke.
-
Labs Progressive Resample
Resamples a curve progressively based on an attribute
-
Labs Quad Sphere
Creates a quad sphere
-
Labs Quadrangulate
Simple Node to take a triangulated mesh and attempt to collapse the diagonal edges to return the mesh to a quad dominant state
-
Labs Quick Basic Tree
Creates a quick basic tree
-
Labs RBD Edge Strip
Generate polystrips on fractured geometry for extra destruction detail in game engines.
-
Labs RBD to FBX
This tool allows for fast export of an RBD Sim to bone based FBX
-
Labs Random Selection
Randomly selects a subset of input points or primitives.
-
Labs Regions from Image
-
Labs Remove Inside Faces
This tool removes inside faces for objects that are intersecting.
-
Labs Remove UV Distortion
Remove UV Distortion tries to reduce UV distortion by inserting new seams
-
Labs Repair
Quickly Spot Heal a Mesh
-
Labs RizomUV Optimize
Enables the use of RizomUV and performs a UV optimize inside Houdini
-
Labs RizomUV Processor
Enables the use of RizomUV within Houdini.
-
Labs RizomUV Rectangularize
Enables the use of RizomUV and performs a UV rectangularize inside Houdini
-
Labs RizomUV Unwrap
Enables the use of RizomUV and performs a UV unwrap inside Houdini
-
Labs Road Generator
Generate roads from curves or OSM data
-
Labs SciFi Panels
Example HDA from the Rebirth Project to generate Sci Fi Panneling
-
Labs Settlement Connections (Beta)
This node generates connections between points of interest based on angle and distance calculations.
-
Labs Simple Baker
SOP Based Baking of Texture Maps
-
Labs Simple Retime
Simple Interface to Change the Timing of an animation
-
Labs Simple Rope Wrap
Generate a rubber band like rope around an object based on inputs.
-
Labs Simple Shapes
Creates simple 2D shapes.
-
Labs Sine Wave
Deforms a mesh based on a sine wave curve
-
Labs Sketchfab
Uploads geometry to Sketchfab
-
Labs Skinning Converter
Skinning Converter is a SOP that can convert any non-changing topology deforming mesh sequence into a bone based animation.
-
Labs Snow Buildup
Creates geometry to an input mesh that mimics snow build up.
-
Labs Soften Normals
Soften Normals is a convenience SOP that is frequently used to prepare geometry for baking.
-
Labs Sort
A wrapper around the default Sort SOP that adds a Circular (Around Vector) mode.
-
Labs Spiral
Creates a spiral curve
-
Labs Splatter
Creates a POP Fluid simulation setup for splattering.
-
Labs Split Primitives by Normal
Split primitives into separate outputs based on normals
-
Labs Static Fracture Export
The Static Fracture SOP takes static geometry data from sop level, and separates them into newly generated geometry containers on object level
-
Labs Straight Skeleton 2D
Generate the central curve (straight skeleton) for 2D input shapes.
-
Labs Straight Skeleton 3D
Generates a curve based on the internal structure of a mesh
-
Labs Straighten
Orients a mesh based on UP and FRONT groups
-
Labs Substance Material
Loads a Substance Archive and assigns it as a material
-
Labs Superformula Shapes
This tool creates 2D shapes using the superformula equation.
-
Labs Sweep Geometry
Sweeps geometry along a curve.
-
Labs Symmetrize
Clips and mirrors geometry along an axis.
-
Labs Terrain Analysis (Beta)
This node analyzes a HeightField and generates cost and avoidance attributes.
-
Labs Terrain Layer Export
The terrain layer export SOP exports a heightfield with the correct settings for Unreal.
-
Labs Terrain Layer Import
The terrain layer import SOP exports a heightfield with the correct settings from Unreal.
-
Labs Terrain Mesh ROP
The Terrain Mesh Output allows you to convert the plugged in heightfield into (tiled) geometry.
-
Labs Terrain Texture ROP
The Terrain Texture Output renders image data from a heightfield.
-
Labs Test Geometry: Luiz
A scan of Luiz Kruel
-
Labs Test Geometry: Paul
A scan of Paul Ambrosiussen
-
Labs Texel Density
Calculates and corrects texel density of an asset.
-
Labs Thicken
Extrudes a mesh along it’s averaged normals
-
Labs Trace PSD File
Generates Curves from Photoshop file layers.
-
Labs Tree Branch Generator
Generates tree branches
-
Labs Tree Branch Placer
Manually place tree branches
-
Labs Tree Branch Placer
-
Labs Tree Controller
Controls other tree nodes
-
Labs Tree Hierarchy
This tool extracts geometry and pivot points from trees created with Labs Tree Generator tools for use with Labs Unreal PivotPainter.
-
Labs Tree Leaf Generator
Generates leaves on branches
-
Labs Tree Simple Leaf
Simple leaf generator for visualization purposes
-
Labs Tree Trunk Generator
Generates a tree trunk
-
Labs Trim Texture
Interactive version of the Trim Texture node.
-
Labs Trim Texture Utility
Helps preparing trim texture geometry for a Trim Texture workflow
-
Labs Triplanar Displace
Displacing geometry based on a triplanar projection
-
Labs Turntable
Rotates the input geometry around itself based on the timeline
-
Labs UDIM Tile Number
Creates a UDIM tile number attribute on primitives, points, or vertices.
-
Labs UV Remove Overlap
Marks and optionally repairs UV overlaps.
-
Labs UV Transfer
Transfer UVs between a source and target geometry.
-
Labs UV Unitize
Converts every primitive to 0-1 UVs
-
Labs UV Unwrap Cylinder
Unwraps cylindrical shaped meshes.
-
Labs UV Visualize
Different methods of visualizing UV Data
-
Labs Unreal Groom Export
Exports hair to Unreal Engine.
-
Labs Unreal Pivot Painter
Pivot Painter stores model pivot and rotation information for geometry used in a shader.
-
Labs Unreal Spline (Beta)
Takes a curve and turns it into an Unreal Spline, it can import and export multiple splines.
-
Labs Unreal Worldcomposition Prepare
Prepare heightfield and actor instances for use with World Composition in Unreal
-
Labs VDB Transform Properties
Converts the input volume/VDB field to a VDB vector field and updates how the vector field will respond to transformations downstream.
-
Labs Validate Geometry Type
This node evaluates the geometry types of the input geometry and returns a warning message if the specified geometry type and type count are not found.
-
Labs Vector Field Export
Export a vector field, compatible with Unreal Engine.
-
Labs View Vertex Order
A simple utility that creates arrow indicators on poly primitives displaying their vertex order.
-
Labs Visualize Vector
Visualizes vectors as arrows.
-
Labs Volume Adjust Look
Adjusts volume visualization mode (default / normals / motion vectors), density, colors (including greyscale colors), emission, and viewport rendering quality.
-
Labs VolumeTexture Export
Take a volume as an input and export a texture of the density field.
-
Labs WFC Initialize Grid
A utility tool to initialize a WFC grid to be used with the WFC Solver
-
Labs WFC Sample Paint
A utility tool to paint attribute values on a grid used by the WFC Solver
-
Labs Wang Tiles Decoder
A decoder that decodes color information into Wang Tilesets.
-
Labs Wang Tiles Sample
Sample tiles that can be used as Wang Tilesets.
-
Labs XYZ Pointcloud Exporter
Export a pointcloud to XYZ file.
-
Labs ZibraVDB Compress
Compresses a VDB sequence and caches it to disk as a single .zibravdb file.
-
Labs ZibraVDB Decompress
Loads a single .zibravdb file from disk and decompresses it as a VDB sequence.
-
Labs ZibraVDB File Cache
Performs compression and caching, or loading and decompression, of a VDB sequence to or from a single .zibravdb file.
-
Laplacian
Computes a discrete Laplacian matrix.
-
Lattice Deform
Deforms geometry based on how you reshape control geometry.
-
Lattice from Volume
Create a point cloud, connected polyline, tet or hex mesh around the active region of volumes. This node creates a deformation lattice for use with the Volume Deform node.
-
Lidar Import
Reads a lidar file and imports a point cloud from its data.
-
Line
Creates polygon or NURBS lines from a position, direction, and distance.
-
Linear Reduce
Compute the components of a reduced loss function.
-
Linear Solver
Solves system of linear equations.
-
MDD
Animates points using an MDD file.
-
ML Attribute Generate
Generate multiple copies of the input geometry with specified attributes randomized.
-
ML Deform
Use an ML model to deform the skin of a character.
-
ML Example
Create examples from input components and an optional target components
-
ML Example Decompose
Obtain the input components and the optional target components from examples
-
ML Example Import
Import examples from a raw file
-
ML Example Partition
Partition examples into parts that each have a specified maximum size
-
ML Extract Example
Extract a single example from a set of examples
-
ML Pose Deserialize
Obtain a pose from a float point attribute.
-
ML Pose Generate
Generate a set of random poses.
-
ML Pose Serialize
Represent a pose as a float point attribute.
-
ML Regression Inference
Apply a model trained using ML Train Regression in a geometry network.
-
ML Regression Kernel
Determine an output based on a kernel model that optimally fits given labeled examples.
-
ML Regression Linear
Determine an output based on a linear model that optimally fits given labeled examples.
-
ML Regression Proximity
Determine an output based on the proximity of a query input to the inputs of labeled examples.
-
ML Volume Tile Component
Crops volumes so they can be used with other ML SOPs as training examples
-
ML Volume Tile Inference
Runs an ONNX model on volume tiles
-
ML Volume Upres
Increases the resolution of an input volume using an ONNX model
-
MPM Collider
Defines VDB colliders to bounce or kill MPM material.
-
MPM Container
Defines the simulation resolution, start frame, and domain limits of a MPM simulation.
-
MPM Debris Source
Extracts points of potential emission for secondary simulations derived from a primary MPM simulation.
-
MPM Deform Pieces
Transfers the dynamics of the MPM simulation onto the renderable geometry.
-
MPM Post-Fracture
Fractures the renderable geometry represented in a MPM simulation using the final state of the simulation.
-
MPM Solver
Solves the MPM simulation described by its inputs and parameters.
-
MPM Source
Creates MPM particles from a geometry mesh or volume.
-
MPM Surface
Generates a surface based on a MPM simulation.
-
Magnet
Deforms geometry by using another piece of geometry
to attract or repel points.
-
Map Points
Stores a reference on a point to a point in another geometry.
-
Mask by Feature
Creates a point attribute mask based on visibility/lighting, letting you limit the effect of other nodes to areas that are visible, or facing a certain direction, or in shadow.
-
Match Axis
Aligns the input geometry to a specific axis.
-
Match Size
Resizes and recenters the input geometry to match a reference bounding box.
-
Match Topology
Reorders the primitive and point numbers of the input geometry to match some reference geometry.
-
Material
Assigns one or more materials to geometry.
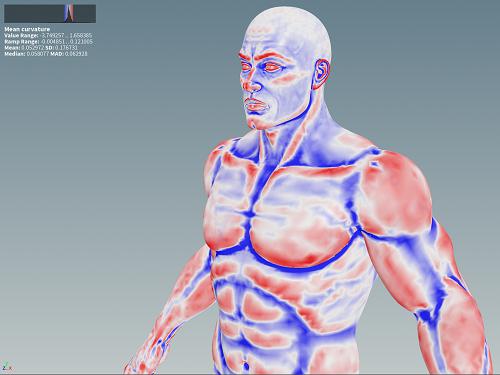
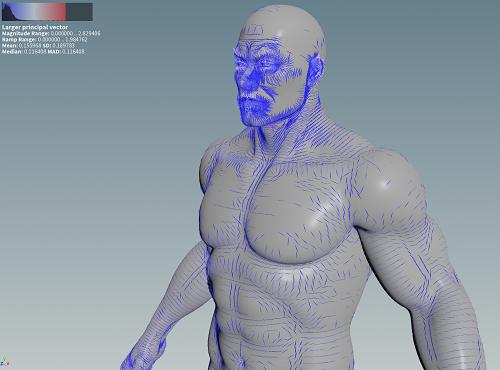
-
Measure
Measures area, volume, or curvature of individual elements or larger pieces of a geometry and puts the results in attributes.
-
Measure Thickness
Measures point-wise thickness.
-
Merge
Merges geometry from its inputs.
-
Merge Packed
Merges and names geometry from its inputs.
-
MetaGroups
Defines groupings of metaballs so that separate groupings are treated
as separate surfaces when merged.
-
Metaball
Creates metaballs and meta-superquadric surfaces.
-
Mirror
Duplicates and mirrors geometry across a mirror plane.
-
Mocap Import
Parses and imports motion capture data as geometry.
-
Mocap Stream
This SOP outputs live motion capture data from various devices
-
Motion Mixer
Combines animation clips and effects to generate character animation.
-
Motion Mixer FX
Defines Motion Mixer Effects.
-
Motion Mixer Fetch
Fetches the motion mixer’s internal geometry when cooking a MotionClip effect.
-
Motion Mixer Retime
Defines a Motion Mixer Retime Effect.
-
Motion Mixer Setup
Initializes a Motion Mixer.
-
Motion Mixer Smooth
Defines a Motion Mixer Smooth Effect.
-
Motion Mixer Transform
Defines a Motion Mixer Transform Effect.
-
MotionClip
Converts a skeleton animation to a MotionClip.
-
MotionClip Blend
Blends the animation of one MotionClip on top of another
-
MotionClip Cycle
Smoothly loops a section of a MotionClip
-
MotionClip Evaluate
Evaluates a single frame of a MotionClip.
-
MotionClip Extract
Extracts the motion of joints over a set of frames from a MotionClip.
-
MotionClip Extract Key Poses
Identifies the key poses of an animation
-
MotionClip Extract Locomotion
Extracts the locomotion from a MotionClip and manages its representation.
-
MotionClip Pose Delete
Removes the specified poses from the MotionClip.
-
MotionClip Pose Insert
Adds a new sample to a MotionClip containing the given pose
-
MotionClip Retime
Adjusts the timing of a MotionClip
-
MotionClip Sequence
Concatenates two MotionClips.
-
MotionClip Update
Update a MotionClip using the given point list.
-
Muscle Adjust Volume
Adjusts volume of muscle geometry.
-
Muscle Auto Tension Lines
Creates a tension line for each muscle by finding the longest line between muscle ends.
-
Muscle Constraint Properties Otis
Creates and modifies the muscle Otis constraints for the input solid muscle geometry in preparation for the muscle simulation.
-
Muscle Constraint Properties Vellum
Creates and modifies the muscle Vellum constraints for the input solid muscle geometry in preparation for the muscle solver.
-
Muscle Deform
Deforms muscles based on rest and target bone geometry using a fast, quasi-static solve for realistic volume-preserving motion.
-
Muscle Deintersect
Separates intersecting muscle geometry by resolving collisions.
-
Muscle Flex
Activates and animates the contraction and relaxation of input solid muscle geometry.
-
Muscle ID
Creates and assigns Muscle IDs to each connected cluster of primitives on the input geometry.
-
Muscle Merge
Merges muscle geometry from its inputs.
-
Muscle Mirror
Duplicates muscle geometry with symmetry. Muscle attributes are also copied/renamed with symmetry.
-
Muscle Paint
A stroke-based paint tool for modifying muscle attributes.
-
Muscle Preroll
Transitions input bone, muscle, tissue, or skin geometry from their static t-poses into the start frame of their animated sequence.
-
Muscle Properties Otis
Creates and modifies the physical properties for the input solid muscle geometry in preparation for the Otis solver.
-
Muscle Properties Vellum
Creates and modifies the physical properties for the input solid muscle geometry in preparation for the Vellum muscle solver.
-
Muscle Solidify
Converts input surface geometry to a tetrahedral mesh for use as muscles.
-
Muscle Solver Vellum
Computes the dynamics simulation for the muscle pass using Vellum.
-
Muscle Tension Lines
Creates and attaches line segments to input bone surface geometry that then drive muscle flexion.
-
Muscle Tension Lines Activate
Calculates activation values for tension lines based on the position of the animated bones and the settings specified on the node.
-
Muscle Transfer
Transfers muscle and bones geometry between characters.
-
Name
Creates a naming attribute on points or primitives allowing you
to refer to them easily, similar to groups.
-
Neural Point Surface
Turns a point cloud into a VDB surface using a pretrained convolutional neural network.
-
Normal
Computes surface normal attribute.
-
Null
This node passes its input through to its output unchanged. It can act as a fixed place in the network for path references.
-
ONNX Inference
Applies inference from an ONNX Machine Learning model.
-
Object Merge
Merges geometry from multiple sources and allows you to define the manner in which they are grouped together and transformed.
-
Ocean Evaluate
Deforms input geometry based on ocean spectrum volumes.
-
Ocean Foam
Generates particle-based foam
-
Ocean Source
Generates particles and volumes from ocean spectrum volumes for use in simulations
-
Ocean Spectrum
Generates volumes containing information for simulating ocean waves.
-
Ocean Waves
Instances individual waveforms onto input points and generated points.
-
OpenCL
Executes an OpenCL kernel on geometry.
-
Orient Joints
Orients joints on a target skeleton.
-
Orientation along Curve
Computes orientations (frames) along curves.
-
Otis Muscle and Tissue Configure
Creates Muscle & Tissue constraints compatible the Otis Solver SOP.
-
Otis Solver
Summary.
-
Output
Marks the output of a sub-network.
-
Pack
Packs geometry into an embedded primitive.
-
Pack Folder
Packs inputs into a folder structure.
-
Pack Inject
Replaces the contents of Packed Primitives in-place.
-
Pack Points
Packs points into a tiled grid of packed primitives.
-
Packed Disk Properties
Change Properties of Packed Disk Primitives.
-
Packed Folder Copy
Copies or renames packed folders.
-
Packed Folder Split
Extracts contents from a packed folder structure.
-
Packed Properties
Change Properties of Packed Primitives.
-
Paint Color Volume
Creates a color volume based on drawn curve
-
Paint Fog Volume
Creates a fog volume based on drawn curve
-
Paint SDF Volume
Creates an SDF volume based on drawn curve
-
Parent Joints
Parent Joints on a target skeleton.
-
Particle Fluid Surface
Generates a surface around the particles from a particle fluid simulation.
-
Particle Fluid Tank
Creates a set of regular points filling a tank.
-
Particle Trail
Generates trails from the incoming particles that can be used to render sparks, fireworks, and rain.
-
Path Deform
Deforms geometry using the shape of a curve.
-
Peak
Moves primitives, points, edges or breakpoints along their normals.
-
Pendulum Motion
Inserts periods of pendulum motion into the middle of character animations.
-
Planar Inflate
Inflates a polygon into a triangle mesh.
-
Planar Patch
Creates a planar polygonal patch.
-
Planar Patch from Curves
Fills in a 2d curve network with triangles.
-
Planar Pleat
Deforms flat geometry into a pleat.
-
Planar Tiles
Generates rectangular tiles for texture patterns.
-
Platonic Solids
Creates platonic solids of different types.
-
Point Capture
Generates connectivity aware capture weights for use with Point Deform.
-
Point Cloud Iso
Constructs an iso surface from its input points.
-
Point Cloud Measure
Measures unorganized points using the characteristics of each point’s neighborhood, and puts the results in attributes.
-
Point Cloud Normal
Computes point cloud normal vectors and gives them a consistent direction.
-
Point Cloud Reduce
Reduces a point cloud using a point grid.
-
Point Cloud Surface
Constructs a surface from a point cloud.
-
Point Deform
Deforms geometry according to an arbitrary connected point mesh.
-
Point Generate
Creates new points, optionally based on point positions in the input geometry.
-
Point Jitter
Jitters points in random directions.
-
Point Relax
Moves points with overlapping radii away from each other, optionally on a surface.
-
Point Replicate
Generates a cloud of points around the input points.
-
Point Split
Splits points shared by multiple vertices, optionally only if the vertices
differ in attribute values.
-
Point Velocity
Computes and manipulates velocities for points of a geometry.
-
Point Weld
Merges points interactively.
-
Points from Volume
Creates set of regular points filling a volume.
-
Poly Bridge
Creates flat or tube-shaped polygon surfaces between source and destination edge loops, with controls for the shape of the bridge.
-
Poly Expand 2D
Creates offset polygonal geometry for planar polygonal graphs.
-
Poly Extrude
Extrudes polygonal faces and edges.
-
PolyBevel
Creates straight, rounded, or custom fillets along edges and corners.
-
PolyCut
Breaks curves where an attribute crosses a threshold.
-
PolyDoctor
Helps repair invalid polygonal geometry, such as for cloth simulation.
-
PolyFill
Fills holes with polygonal patches.
-
PolyFrame
Creates coordinate frame attributes for points and vertices.
-
PolyHinge
Extrudes polygonal faces around a pivot line.
-
PolyLoft
Creates new polygons using existing points.
-
PolyPatch
Creates a smooth polygonal patch from primitives.
-
PolyPath
Cleans up topology of polygon curves.
-
PolyReduce
Reduces the number of polygons in a model while retaining its shape. This node preserves features, attributes, textures, and quads during reduction.
-
PolySoup
Combines polygons into a single primitive that can be more efficient for many polygons
-
PolySpline
The PolySpline SOP fits a spline curve to a polygon or hull and
outputs a polygonal approximation of that spline.
-
PolySplit
Divides an existing polygon into multiple new polygons.
-
PolyWire
Constructs polygonal tubes around polylines, creating
renderable geometry with smooth bends and intersections.
-
Pose Difference
Compute the difference between point transforms on two SOP skeletons.
-
Pose Scope
Assigns channel paths and/or pickscripts to geometry.
-
Pose-Space Deform
(Deprecated) Interpolates between a set of pose-shapes based on the value of a set of drivers.
-
Pose-Space Deform Combine
(Deprecated) Combine result of Pose-Space Deform with rest geometry.
-
Pose-Space Edit
(Deprecated) Packs geometry edits for pose-space deformation.
-
Pose-Space Edit Configure
(Deprecated) Creates common attributes used by the Pose-Space Edit SOP.
-
Primitive Properties
Edits primitive, primitive attributes, and profile curves.
-
Principal Component Analysis
Computes the principle components of volume or point data.
-
Projectile Motion
Inserts periods of projectile motion into the middle of character animations.
-
Proximity
Finds the nearest points to one or more target points.
-
Pyro Bake Volume
Helps develop the volume look both for viewport display and rendering after the pyro solve.
-
Pyro Burst Source
Creates points suitable for sourcing into pyro simulations to create explosions, muzzle flashes, shockwaves, and detonation rings.
-
Pyro Post-Process
Applies common post-processing effects to the results of Pyro solves.
-
Pyro Scatter from Burst
Generates a cloud of points around the input points suitable for pyro trails and particle simulations.
-
Pyro Solver
Runs a dynamic Pyro simulation.
-
Pyro Source
Creates points for sourcing pyro and smoke simulations.
-
Pyro Source Instance
Creates source instance points from spawn points for sourcing pyro
simulations with packed sets.
-
Pyro Source Pack
Creates a packed source set from the input volumes.
-
Pyro Source Spread
Pyro Source Spread solves for the spreading of flame across a point cloud.
-
Pyro Spawn Sources
Creates spawn points for sourcing pyro simulations with packed sets.
-
Pyro Thruster Exhaust
Creates volumes and particles to simulate thruster exhausts without the need of simulation.
-
Pyro Trail Path
Generates curves to use as trails for the Pyro Trail Source node.
-
Pyro Trail Source
Creates points suitable for sourcing into pyro simulations to create trails for explosions.
-
Python
Runs a Python snippet to modify the incoming geometry.
-
Python Snippet
Runs a snippet of Python on geometry.
-
Quad Remesh
Converts an arbitrary mesh into structured quadrilaterals.
-
RBD Bullet Solver
Runs a dynamic Bullet simulation.
-
RBD Car Deform
Add Post-Sim Deformations to RBD Cars.
-
RBD Car Follow Path
Animate a RBD Car Rig along a path.
-
RBD Car Fracture
Fracture a RBD Car Rig.
-
RBD Car Rig
Builds a drivable RBD Car Rig.
-
RBD Car Transform
Transform a fractured car.
-
RBD Cluster
Combines fractured pieces or constraints into larger clusters.
-
RBD Cone Twist Constraint Properties
Creates attributes describing rigid body cone twist constraints.
-
RBD Configure
Packs and creates attributes describing rigid body objects.
-
RBD Connected Faces
Stores the primitive number and distance to the opposite face on the inside faces of fractured geometry.
-
RBD Constraint Properties
Creates attributes describing rigid body constraints.
-
RBD Constraints From Curves
Creates rigid body constraint geometry from curves drawn in the viewport.
-
RBD Constraints From Lines
Creates rigid body constraint geometry from interactively drawn lines in the viewport.
-
RBD Constraints From Rules
Creates rigid body constraint geometry from a set of rules and conditions.
-
RBD Convert Constraints
Converts existing constraint prims into constraints with different anchor positions.
-
RBD Deform Pieces
Deforms geometry with simulated proxy geometry.
-
RBD Deforming to Animated
Converts deforming geometry to animated static packed objects.
-
RBD Disconnected Faces
Detects when connected faces have become separated.
-
RBD Exploded View
Visualize RBD fractured geometry merged with the proxy geometry, pushed out from the center to create an exploded view.
-
RBD Find Instances
Find instances of the same geometry pieces and replace them with packed geometry instances.
-
RBD Group Constraints
Creates constraint groups from anchored RBD pieces groups.
-
RBD Guide Setup
Sets attributes on packed fragments for the RBD Guide DOP.
-
RBD I/O
Packs RBD fractured geometry, saves them to disk, and loads them back again.
-
RBD Interior Detail
Creates additional detail on the interior surfaces of fractured geometry.
-
RBD Match Transforms
Given an untransformed reference, extracts the transforms for each piece per name, from either Geometry or Proxy Geometry, and applies them to the geometry with the corresponding name attribute.
-
RBD Material Fracture
Fractures the input geometry based on a material type.
-
RBD Pack
Packs RBD geometry, constraints, and proxy geometry into a single geometry.
-
RBD Paint
Paints values onto geometry or constraints using strokes.
-
RBD Transform
The RBD Transform operator performs a Transform operation on all 3 source geometries (Geometry, Constraint Geometry and Proxy Geometry) at once.
-
RBD Unpack
Unpacks an RBD setup into three outputs.
-
RMan Shader
Attaches RenderMan shaders to groups of faces.
-
ROP FBX Animation Output
Export animation from geometry-based skeleton to an FBX file.
-
ROP FBX Character Output
Export a skinned character with geometry-based skeleton to an FBX file.
-
ROP GLTF Character Output
Export a skinned character with a geometry-based skeleton to a glTF or glb (binary) file.
-
ROP Geometry Output
-
ROP Geometry Raw Output
-
Ragdoll Collision Shapes
Creates collision shapes for a KineFX skeleton to be used in a ragdoll RBD simulation.
-
Ragdoll Solver
Runs a ragdoll RBD simulation on the target skeleton.
-
Rails
Generates surfaces by stretching cross-sections between
two guide rails.
-
Raw Import
Imports raw binary files as point, detail, or volumes.
-
Ray
Projects one surface onto another.
-
Recipe Builder
Creates a subnetwork with spare parameters to use as a container for recipe creation.
-
Refine
Increases the number of points/CVs in a curve or surface
without changing its shape.
-
Reguide
Scatters new guides, interpolating the properties of existing guides.
-
Remesh
Recreates the shape of the input surface using high-quality (nearly equilateral) triangles.
-
Remesh Bubbles
Generates foam bubble like structure onto a point cloud.
-
Remesh to Camera
Subdivide input geometry to generate polygons smaller than a camera measurement.
-
Remesh to Grid
Rebuilds polygonal topology to straighten edges, close small holes, and remove interior geometry.
-
Repack
Repacks geometry as an embedded primitive.
-
Resample
Resamples one or more curves or surfaces into even length segments.
-
Rest Position
Creates rest attributes on the geometry so procedural
textures stay put on the surface as it deforms.
-
Retime
Retimes the time-dependent input geometry.
-
Reverse
Reverses or cycles the vertex order of faces.
-
Reverse Foot
Creates a reverse foot set up for the given input skeleton.
-
Revolve
Revolves a curve around a center axis to sweep out a surface.
-
Rewire Vertices
Rewires vertices to different points specified by an attribute.
-
Rig Attribute VOP
Runs a VOP network to modify geometry attributes on a KineFX rig.
-
Rig Attribute Wrangle
Runs a VEX snippet to modify transform attribute values on a KineFX rig.
-
Rig Copy Transforms
Attach the joints of a skeleton SOP to another, posed skeleton.
-
Rig Doctor
Optimizes and runs checks on a SOP skeleton.
-
Rig Match Pose
Conforms the rest poses of two skeletons in preparation for retargeting.
-
Rig Mirror Pose
Mirrors a SOP skeleton’s pose.
-
Rig Pose
Poses and animates a SOP rig or skeleton.
-
Rig Python
Runs a Python snippet to modify the incoming rig geometry.
-
Rig Stash Pose
Stores a static pose on a skeleton as a matrix point attribute.
-
Ripple
Generates ripples by displacing points along the up direction
specified.
-
Ripple Solver
Runs ripple simulations on geometry surfaces.
-
Room Map Frame
Setup geometry for usage with Karma Room Map
-
Scatter
Scatters new points randomly across a surface or through a volume.
-
Scatter and Align
Scatters points across a surface with randomized scale and orientation attributes for use with Copy to Points.
-
Scatter in Texture Mask
Scatters points on a mesh, with density controlled by a texture.
-
Scene Character Export
Export animation from a geometry-based character to the Scene (OBJ) context.
-
Scene Character Import
Creates a geometry-based character with animation from the Scene (OBJ) context.
-
Script
Runs scripts when cooked.
-
Sculpt
Interactively reshape a surface using brushes that push, pull, flatten, smooth, or deform the mesh similarly to sculpting a clay model.
-
Secondary Motion
Adds secondary motion effects to a static or animated input KineFX joint, skeleton, or character.
-
Separate Pieces
Separates geometry pieces based on a shared attribute.
-
Sequence Blend
Morphs though a sequence of 3D shapes, interpolating geometry and attributes.
-
Set T-Pose
Stores the rest position for the input bone, muscle, or tissue geometry.
-
Shallow Water Solver
Runs shallow water simulations on height fields.
-
Shape Diff
Computes the post-deform or pre-deform difference of two geometries with similar topologies.
-
Shot Sculpt
Interactive tool for creating and managing time-based deformations.
-
Shrinkwrap
Computes the convex hull of the input geometry and moves its polygons inwards along their normals.
-
Skeleton
Interactively creates and edits geometry-based skeletons.
-
Skeleton Blend
Blends the poses of multiple skeletons.
-
Skeleton Mirror
Modifies an input skeleton by duplicating joints across a mirror plane.
-
Skin
Builds a skin surface between any number of shape curves.
-
Skin Deform
Performs quasi-static deformation of skin geometry based on muscle and bone inputs.
-
Skin Properties
Creates and modifies skin attributes in preparation for the skin solver.
-
Skin Solidify
Converts surface geometry to a solid (tetrahedrons) and prepares the output geometry for solving with a skin solver.
-
Skin Solver Vellum
Computes the dynamics simulation for the skin pass using Vellum.
-
Sky Box
Creates a volume filled with volumetric clouds.
-
Sky Field
Generates an initial Sky Field volume to use with sky tools.
-
Sky Field Noise
Modifies a Sky Field using 2D cloud noise.
-
Sky Field Pattern
Modifies a Sky Field using a 2D cloud pattern.
-
Sky Field from Map
Modifies a Sky Field using an image saved on your disk.
-
Smooth
Smooths out (or relaxes) polygons, meshes and curves without increasing the number of points.
-
Smooth Motion
Smooths out unwanted noise in the animated input points or the KineFX joint, skeleton, or MotionClip.
-
Soft Peak
Moves the selected point along its normal or a custom normalized point attribute,
with smooth rolloff to surrounding points.
-
Soft Transform
Moves the selected point, with smooth rolloff to surrounding points.
-
Solid Fracture
Creates a partition of a tetrahedral mesh that can be used for finite-element fracturing.
-
Solver
Allows running a SOP network iteratively over some input geometry, with the output of the network from the previous frame serving as the input for the network at the current frame.
-
Sort
Reorders points and primitives in different ways, including randomly.
-
Sphere
Creates a sphere or ovoid surface.
-
Spiral
Creates spirals and helices.
-
Spline Align
Aligns a group of primitives to each other or to an auxiliary input.
-
Spline Basis
Provides operations for moving knots within the parametric space
of a NURBS curve or surface.
-
Spline Cap
Closes open areas with flat or rounded coverings.
-
Spline Clay
Lets you deform NURBS faces and NURBS surfaces by pulling points that lie
directly on them.
-
Spline Creep
Deforms and animates a piece of geometry across a surface.
-
Spline Curve Clay
Deforms a spline surface by reshaping a curve on the surface.
-
Spline Fillet
Creates smooth bridging geometry between two curves or surfaces.
-
Spline Fit
Fits a spline curve to points, or a spline surface to a mesh of points.
-
Spline Profile
Extracts or manipulates profile curves.
-
Spline Project
Creates profile curves on surfaces.
-
Spline Round
Generates round fillets of a specified radius between two surfaces.
-
Spline Surfsect
Trims or creates profile curves along the intersection lines
between NURBS or bezier surfaces.
-
Spline Trim
Trims away parts of a spline surface defined by a profile curve
or untrims previous trims.
-
Split
Splits primitives or points into two streams.
-
Split by Point Attribute
Splits geometry along edges where a point attribute changes.
-
Spray Paint
Spray paints random points onto a surface.
-
Sprite
A SOP node that sets the sprite display for points.
-
Stabilize Joint
Removes jitter from the input animation and handles geometry snapping of joints.
-
Starburst
Insets points on polygonal faces.
-
Stash
Caches the input geometry in the node on command, and then uses it as the node’s output.
-
Stitch
Stretches two curves or surfaces to cover a smooth area.
-
Stroke
Low level tool for building interactive assets.
-
Subdivide
Subdivides polygons into smoother, higher-resolution polygons.
-
Subnetwork
The Subnet op is essentially a way of creating a macro to represent a collection of ops as a single op in the Network Editor.
-
Super Quad
Generates an isoquadric surface.
-
Surface Deform
Deforms points using a polygon surface.
-
Sweep
Creates a surface by sweeping a cross section curve along a spine curve.
-
Switch
Switches between network branches based on an expression or keyframe animation.
-
Switch-If
Switches between two network branches based on an expression or geometry test.
-
TOP Geometry
Sends input geometry to a TOP subnet and retrieves the output geometry.
-
TOP Network
The TOP Network operator contains SOP nodes for running tasks.
-
Table Import
Reads a CSV file creating point per row.
-
Tangent Field
Creates a smooth tangent (multi-) vector field on a polygonal surface.
-
Test Geometry: Capybara
Creates a capybara, which can be used as test geometry.
-
Test Geometry: Crag
Creates a rock creature, which can be used as test geometry.
-
Test Geometry: Electra
Creates Electra, the test KineFX character.
-
Test Geometry: Otto
Creates Otto, a production quality test character.
-
Test Geometry: Pig Head
Creates a pig head, which can be used as test geometry..
-
Test Geometry: Rubber Toy
Creates a rubber toy, which can be used as test geometry.
-
Test Geometry: Shader Ball
Creates a shader ball, which can be used to test shaders.
-
Test Geometry: Squab
Creates a squab, which can be used as test geometry.
-
Test Geometry: Template Body
Creates a template body, which can be used as test geometry.
-
Test Geometry: Template Head
Creates a template head, which can be used as test geometry.
-
Test Geometry: Tommy
Creates a soldier, which can be used as test geometry.
-
Test Simulation: Crowd Transition
Provides a simple crowd simulation for testing transitions between animation clips.
-
Test Simulation: Ragdoll
Provides a simple Bullet simulation for testing the behavior of a ragdoll.
-
Tet Conform
Creates a tetrahedral mesh that conforms to a connected mesh as much as possible.
-
Tet Embed
Creates a simple tetrahedral mesh that covers a connected mesh.
-
Tet Partition
Partitions a given tetrahedron mesh into groups of tets isolated by a given polygon mesh
-
Texture Feature
Uses computer vision to identify feature points in an image.
-
Texture Mask Paint
Paints a mask into a texture map.
-
Texture Optical Flow
An operator that uses computer vision to track movement between two textures embedded as two-dimensional volumes.
-
TimeShift
Cooks its input at a different time.
-
Tissue Properties Otis
Creates and modifies tissue attributes in preparation for the tissue solver.
-
Tissue Properties Vellum
Creates and modifies tissue attributes in preparation for the Vellum tissue solver.
-
Tissue Solidify Otis
Solidifies an input surface or shell into a volumetric tissue structure composed of tetrahedra, ready for simulation with Otis Solver SOP.
-
Tissue Solidify Vellum
Converts surface geometry to a layered solid (tetrahedrons) and prepares the output geometry for solving with the Vellum tissue solver.
-
Tissue Solver Vellum
Computes the dynamics simulation for the Tissue pass using Vellum.
-
Toon Shader Attributes
Sets attributes used by the Toon Color Shader and Toon Outline Shader.
-
Topo Flow
Deforms a surface to match the size, shape, and texture of a different surface.
-
Topo Flow Sample
An operator that uses computer vision to identify distinct feature points in
a given image file.
-
Topo Landmark
A state interface to establish correspondence from points on one surface
to points on another surface.
-
Topo Slide by Curve References
Slides geometry across a surface using pairs of reference curves.
-
Topo Transfer
Non-rigidly deforms a surface to match the size and shape of a different surface.
-
TopoBuild
Lets you interactively draw a reduced quad mesh automatically snapped to existing geometry.
-
Torus
Creates a torus (doughnut) shaped surface.
-
Trace
Traces curves from an image file or heightfield.
-
Trail
Creates trails behind points.
-
Transform
The Transform operation transforms the source geometry in object space using a transformation matrix.
-
Transform Axis
Transforms the input geometry relative to a specific axis.
-
Transform By Attribute
Transforms the input geometry by a point attribute.
-
Transform Pieces
Transforms input geometry according to transformation attributes on template geometry.
-
Tri Bezier
Creates a triangular Bezier surface.
-
TriDivide
Refines triangular meshes using various metrics.
-
Triangulate 2D
Connects points to form well-shaped triangles.
-
Tube
Creates open or closed tubes, cones, or pyramids.
-
USD Animation Import
Imports a skeleton and animation from a UsdSkel character.
-
USD Character Import
Imports the rest geometry, skeleton, and animation from a UsdSkel character.
-
USD Configure Import
-
USD Configure Prims from Points
-
USD File Export
-
USD File Import
-
USD Skin Import
Imports skinned geometry from a UsdSkel character.
-
UV Auto Seam
Generates an edge group representing suggested seams for flattening a polygon model in UV space.
-
UV Brush
Adjusts texture coordinates in the UV viewport by painting.
-
UV Edit
Lets you interactively move UVs in the texture view.
-
UV Flatten
Creates flattened pieces in texture space from 3D geometry.
-
UV Flatten from Points
Creates UV islands from points that measure distance and direction outward from the sources.
-
UV Fuse
Merges UVs.
-
UV Layout
Packs UV islands efficiently into a limited area.
-
UV Pelt
Relaxes UVs by pulling them out toward the edges of the texture area.
-
UV Project
Assigns UVs by projecting them onto the surface from
a set direction.
-
UV Quick Shade
Applies an image file as a textured shader to a surface.
-
UV Texture
Assigns texture UV coordinates to geometry
for use in texture and bump mapping.
-
UV Transform
Transforms UV texture coordinates on the source geometry.
-
UV Unwrap
Separates UVs into reasonably flat, non-overlapping groups.
-
Unix
Processes geometry using an external program.
-
Unpack
Unpacks packed primitives.
-
Unpack Folder
Extracts contents from a packed folder structure.
-
Unpack Points
Unpacks points from packed primitives.
-
Unpack USD
Converts packed USD primitives into normal Houdini geometry.
-
Unpaste
The Unpaste op removes one or more pasted surfaces from a paste
hierarchy, causing the hierarchy to update.
-
Unsubdivide
Reverses mesh modifications performed by the Catmull-Clark algorithm.
-
VDB
Creates one or more empty/uniform VDB volume primitives.
-
VDB Activate
Activates voxel regions of a VDB for further processing.
-
VDB Activate SDF
Expand or contract signed distance fields stored on VDB volume primitives.
-
VDB Advect
Moves VDBs in the input geometry along a VDB velocity field.
-
VDB Advect Points
Moves points in the input geometry along a VDB velocity field.
-
VDB Analysis
Computes an analytic property of a VDB volumes, such as gradient or curvature.
-
VDB Clip
Clips VDB volume primitives using a bounding box or another VDB as a mask.
-
VDB Collider
Defines VDB colliders to bounce or kill dynamic objects.
-
VDB Combine
Combines the values of two VDB volumes in various ways.
-
VDB Convex Clip SDF
Clips an SDF VDB by a convex hull.
-
VDB Diagnostics
Tests VDBs for Bad Values and Repairs.
-
VDB Extrapolate
Extrapolate a VDB signed distance field.
-
VDB Fracture
Cuts level set VDB volume primitives into multiple pieces.
-
VDB LOD
Build an LOD Pyramid from a VDB.
-
VDB Merge
Combines many VDB volumes in various ways.
-
VDB Morph SDF
Blends between source and target SDF VDBs.
-
VDB Occlusion Mask
Create a mask of the voxels in shadow from a camera for VDB primitives.
-
VDB Points Delete
Deletes points inside of VDB Points primitives.
-
VDB Points Group
Manipulates the Internal Groups of a VDB Points Primitive.
-
VDB Potential Flow
Computes the steady-state air flow around VDB obstacles.
-
VDB Project Non-Divergent
Removes divergence from a Vector VDB.
-
VDB Rasterize Frustum
Rasterize points into density and attribute volumes.
-
VDB Renormalize SDF
Fixes signed distance fields stored in VDB volume primitives.
-
VDB Resample
Re-samples a VDB volume primitive into a new orientation and/or voxel size.
-
VDB Reshape SDF
Reshapes signed distance fields in VDB volume primitives.
-
VDB Segment by Connectivity
Splits SDF VDBs into connected components.
-
VDB Smooth
Smooths out the values in a VDB volume primitive.
-
VDB Smooth SDF
Smooths out SDF values in a VDB volume primitive.
-
VDB Topology to SDF
Creates an SDF VDB based on the active set of another VDB.
-
VDB Vector Split
Splits a vector VDB primitive into three scalar VDB primitives.
-
VDB Vector from Scalar
Merges three scalar VDB into one vector VDB.
-
VDB Visualize Tree
Replaces a VDB volume with geometry that visualizes its structure.
-
VDB from Particle Fluid
Generates a signed distance field (SDF) VDB volume representing the surface of a set of particles from a particle fluid simulation.
-
VDB from Particles
Converts point clouds and/or point attributes into VDB volume primitives.
-
VDB from Polygons
Converts polygonal surfaces and/or surface attributes into VDB volume primitives.
-
VDB to Spheres
Fills a VDB volume with adaptively-sized spheres.
-
Vellum Attach Constraints
Edit or create new vellum attach to geometry and stitch constraints, interactively.
-
Vellum Brush
Interactive brushing of Vellum geometry, grains, and fluids in the viewport.
-
Vellum Configure Grain
Configures geometry for Vellum Grain constraints.
-
Vellum Configure Muscles
Configures muscle geometry attributes and constraints for Vellum simulations.
-
Vellum Configure Tissue
Configures tissue geometry attributes and constraints for Vellum simulations.
-
Vellum Constraint Properties
Modifies common Vellum Constraint properties.
-
Vellum Constraints
Configure constraints on geometry for the Vellum solvers.
-
Vellum Drape
Vellum solver setup to pre-roll fabric to drape over characters.
-
Vellum I/O
Packs Vellum simulations, saves them to disk, and loads them back again.
-
Vellum Pack
Packs Vellum geometry and constraints into a single geometry.
-
Vellum Post-Process
Applies common post-processing effects to the result of Vellum solves.
-
Vellum Reference Frame
Ties Vellum points to a reference frame defined by moving geometry.
-
Vellum Rest Blend
Blends the current rest values of constraints with a rest state calculated from external geometry.
-
Vellum Solver
Runs a dynamic Vellum simulation.
-
Vellum Transform Pieces
Transforms geometry using the rest and solved data from Vellum Shape Match constraints.
-
Vellum Unpack
Unpacks a Vellum simulation into two outputs.
-
Verify BSDF
Verify that a bsdf conforms to the required interface.
-
Visibility
Shows/hides primitives in the 3D viewer and UV editor.
-
Visualize Properties
Lets you adjust display options and attach visualizers to geometry.
-
Visualize Rig
Visualizes the transformations and parenting of a SOP skeleton.
-
Volume
Creates a volume primitive.
-
Volume Adjust Fog
Modifies values on the incoming Volume and VDB primitives.
-
Volume Ambient Occlusion
A node that generates the ambient occlusion field of the provided density field.
-
Volume Analysis
Computes analytic properties of volumes.
-
Volume Arrival Time
Computes a speed-defined travel time from source points to voxels.
-
Volume Blur
Blurs the voxels of a volume.
-
Volume Bound
Bounds voxel data.
-
Volume Break
Cuts polygonal objects using a signed distance field volume.
-
Volume Combine
Combines multiple volumes or VDBs within one geometry into a new volume or VDB.
-
Volume Compress
Re-compresses Volume Primitives.
-
Volume Convolve 3×3×3
Convolves a volume by a 3×3×3 kernel.
-
Volume Deform
Deform a volume using lattice points.
-
Volume FFT
Compute the Fast Fourier Transform of volumes.
-
Volume Feather
Feathers the edges of volumes.
-
Volume Merge
Flattens many volumes into one volume.
-
Volume Mix
Combines the scalar fields of volume primitives.
-
Volume Noise Fog
Adds or generates noise in volume/VDB primitives.
-
Volume Noise SDF
Adds or generates noise and displaces an SDF.
-
Volume Noise Vector
Adds or generates noise in a Vector volume/VDB.
-
Volume Normalize Weights
Ensure a set of volumes add up to one.
-
Volume Optical Flow
Translates the motion between two image volumes into displacement vectors.
-
Volume Patch
Fill in a region of a volume with features from another volume.
-
Volume Ramp
Remaps a volume according to a ramp.
-
Volume Rasterize
Rasterizes into a volume.
-
Volume Rasterize Attributes
Samples point attributes into VDBs.
-
Volume Rasterize Curve
Converts a curve into a volume.
-
Volume Rasterize Hair
Converts fur or hair to a volume for rendering.
-
Volume Rasterize Lattice
Deform a volume using lattice points.
-
Volume Rasterize Particles
Converts a point cloud into a volume.
-
Volume Rasterize Points
Converts a point cloud into a volume.
-
Volume Reduce
Reduces the values of a volume into a single number.
-
Volume Resample
Resamples the voxels of a volume to a new resolution.
-
Volume Resize
Resizes the bounds of a volume without changing voxels.
-
Volume SDF
Builds a Signed Distance Field from an isocontour of a volume.
-
Volume Slice
Extracts 2d slices from volumes.
-
Volume Splice
Splices overlapping volume primitives together.
-
Volume Stamp
Stamps volumes instanced on points into a single target volume.
-
Volume Surface
Adaptively surfaces a volume hierarchy with a regular triangle mesh.
-
Volume Trail
Computes a trail of points through a velocity volume.
-
Volume VOP
Runs CVEX on a set of volume primitives.
-
Volume Vector Join
Merges multiple scalar Volumes into a vector Volume..
-
Volume Vector Split
Splits a vector Volume primitive into scalar Volume primitives.
-
Volume Velocity
Computes a velocity volume.
-
Volume Velocity from Curves
Generates a volume velocity field using curve tangents.
-
Volume Velocity from Surface
Generates a velocity field within a surface geometry.
-
Volume Visualization
Adjusts attributes for multi-volume visualization.
-
Volume Wrangle
Runs a VEX snippet to modify voxel values in a volume.
-
Volume from Attribute
Sets the voxels of a volume from point attributes.
-
Voronoi Adjacency
Create a line segment between points with adjacent Voronoi cells
-
Voronoi Fracture
Fractures the input geometry by performing a Voronoi decomposition of space around the input cell points
-
Voronoi Fracture Points
Given an object and points of impact on the object, this SOP
generates a set of points that can be used as input to the Voronoi
Fracture SOP to simulate fracturing the
object from those impacts.
-
Voronoi Split
Cuts the geometry into small pieces according to a set of cuts
defined by polylines.
-
Vortex Force Attributes
Creates the point attributes needed to create a Vortex Force DOP.
-
Weight Array Biharmonic
Fills in index and weight array pairs for points on a mesh using biharmonic
functions.
-
Weight Array Interpolate
Evaluates weight arrays specified on points on a mesh at a given point within a primitive.
-
Whitewater Post-Process
Prepares the whitewater simulation for rendering.
-
Whitewater Solver
Sets and configures a Whitewater simulation inside a SOP network.
-
Whitewater Source
Generates the emission field for whitewater simulations.
-
Winding Number
Computes generalized winding number of surface at query points.
-
Wire Blend
Morphs between curve shapes while maintaining curve length.
-
Wire Capture
Captures surfaces to a wire,
allowing you to edit the wire to deform the surface.
-
Wire Deform
Deforms geometry captured to a curve via the Wire Capture node.
-
Wire Transfer
Transfers the shape of one curve to another.
-
Wireframe
Constructs polygonal tubes around polylines, creating renderable geometry.
-
Wrinkle Deformer
Deforms geometry to simulate surface wrinkles.
-
_executionprovider_common
-
_mkl_note
-
_ml_attributeserialization_common
-
_ml_example_batch
-
_ml_generate_common
-
_ml_poseserialization_common
-
_ml_regression_kernel
-
_serial_common
-
glTF
-
glTF ROP output driver
-
rop_ml_exampleraw