| On this page |
The APEX graph debugger is a feature of the APEX network view that allows you to execute an APEX graph and inspect the values of the graph’s ports natively within the viewer.
You can turn on the debugger in the APEX network view by pressing ⌃ Ctrl + D or selecting Debug ▸ Enable Debugger on the top toolbar. This executes the graph, and when you hover over a port, a tooltip appears, showing the value of the port.
Viewing graphs 
When a SOP node is selected, the APEX network view attempts to display an APEX graph from the geometry in the node’s first output. If the geometry is not an APEX graph, the APEX network view displays the message, “No graph available”.
You can also have the APEX network view display the APEX graph on a node inside an HDA:
-
 click the HDA and select Type Properties.
 -
In the Edit Operator Type Properties window, go to the Node tab.
-
Set the Dive Target field to the internal HDA node you want to display the graph of. The dive target syntax is:
graph:apex:<path_to_internal_node>
After you do this, a
 badge is displayed beside the HDA in the network view, and you can double-click the HDA to dive into the APEX network view.
Note
You can make an HDA dive into the graph on its own first output (as opposed to an internal node) by setting its Dive Target to “graph:apex:.”. The “.” is the relative path to the HDA node itself.
Graph execution 
A graph’s default parameters are used as its input values when the graph is executed. Some HDAs override these parameters to provide alternative input values as the graph executes.
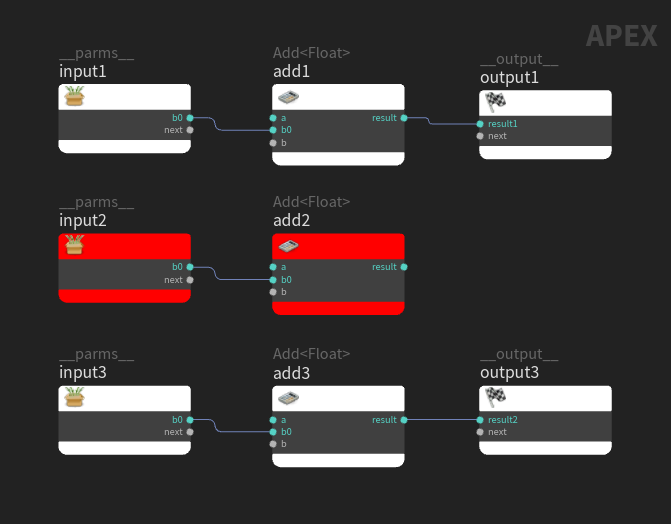
A port is only evaluated if it is part of the graph logic that connects to an output node on the graph. If a port is not evaluated, its tooltip will show Not Evaluated. In the graph below, the red nodes are not part of any graph logic that connects to an output node, so its ports are not evaluated:
Debugging rigs 
The  APEX Scene Animate SOP can display a character’s rig graph and provide the debugger with live input values from the animate state. To debug from the animate state:
-
Enter the animate state - select the APEX Scene Animate SOP, turn on its display flag, and click
 Animate on the toolbar to the left of the viewport.
 -
Dive into the APEX Scene Animate SOP by double-clicking the node. This takes you to the APEX network view.
-
In the animate state, select a control. The APEX network view displays the rig graph that contains the control. For example, if you have two characters in the scene, selecting a control on one character will display the rig graph for that character. If you select a control on a different character, the APEX network view will switch to display the rig graph of the other character.
-
In the APEX network view, turn on the debugger. The port values update as the values of the controls change.
Debugging rig components 
The  APEX AutoRig Component SOP can display two types of graphs - a character’s rig graph and a component script graph (the graph that generates the rig). You can specify the graph to display in the APEX AutoRig Component SOP’s Show Graph parameter.
Debugging the rig graph 
When Show Graph is set to Rig, you can use the APEX AutoRig Component SOP to test a rig using the animate state. The debugger shows different port values depending on whether or not you are in the animate state on the APEX AutoRig Component SOP.
Animate state is active
If you are in the animate state on the APEX AutoRig Component SOP, you can debug the rig similar to how it’s done on the APEX Scene Animate SOP above:
-
Enter the animate state on the APEX AutoRig Component SOP - select the APEX AutoRig Component SOP, turn on its display flag, and click
Animate on the toolbar to the left of the viewport. -
Dive into the APEX AutoRig Component SOP by double-clicking the node. This takes you to the APEX network view, which displays the rig graph.
-
In the APEX network view, turn on the debugger. The port values update as the values of the controls in the viewport change.
Animate state is not active
The APEX network view displays the character’s rig graph even if you are not in the animate state on the APEX AutoRig Component SOP. This is in contrast to the APEX Scene Animate SOP, which requires you to be in the animate state for the rig graph to be displayed.
-
Dive into the APEX AutoRig Component SOP by double-clicking the node. This takes you to the APEX network view.
-
In the APEX network view, turn on the debugger. The port values show the rig graph’s default values rather than the values provided by the animate state.
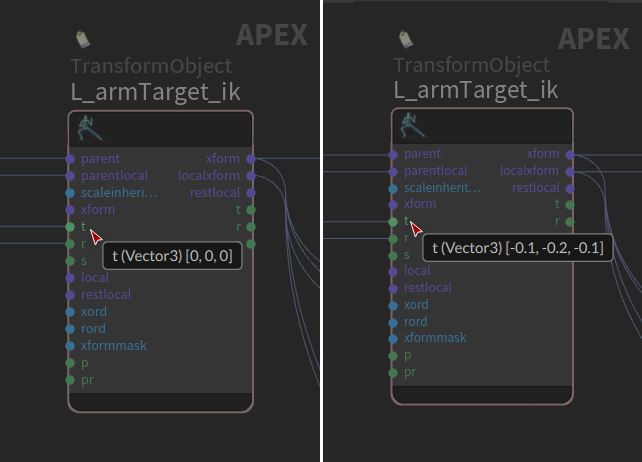
In this example, we see the difference in a port’s values before and after entering the animate state. In the image below, the character’s left hand control has been moved from its rest position in the animate state:

The graphs below show the translate value of the left hand before (left) and after (right) entering the animate state:
Debugging the component graph 
When Show Graph is set to Component Script, the APEX network view displays the component graph (the graph that generates the rig) rather than the rig graph. In this case, the graph’s input values do not come from the animate state, so you don’t need to be in the animate state for the debugger to pick up the correct input port values. The input values are instead populated from the rig component’s parameters on the APEX AutoRig Component SOP.
To debug a component graph:
-
Dive into the APEX AutoRig Component SOP by double-clicking the node. This takes you to the APEX network view, which displays the component graph.
-
In the APEX network view, turn on the debugger. The port values show the values passed through the component graph.